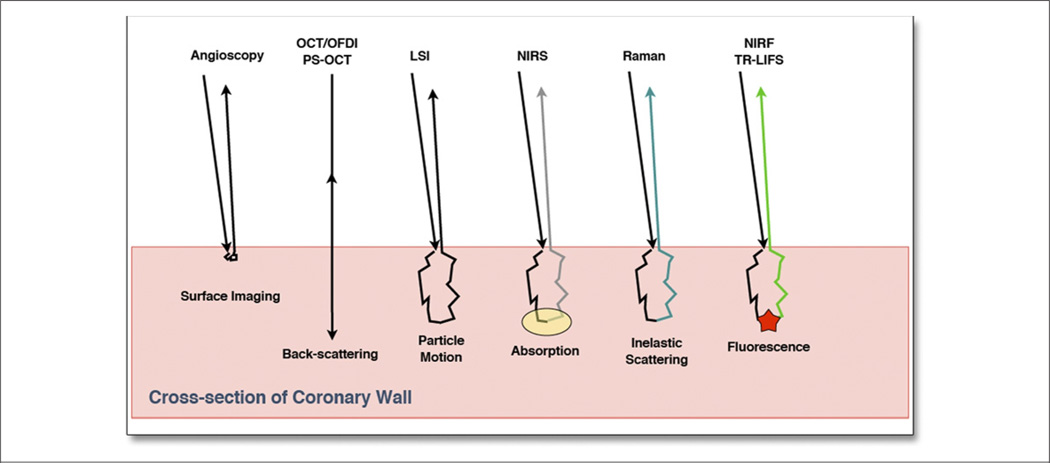
Figure 1. Schematic Diagram.
The diagram shows the predominant light/tissue interactions that are detected in each of the intravascular optical imaging modalities discussed in this review. LSI = laser speckle imaging; NIRF = near-infrared fluorescence; NIRS = near-infrared spectroscopy; OCT = optical coherence tomography; OFDI = optical frequency domain imaging; PS = polarization sensitive; TR-LIFS = time-resolved laser-induced fluorescence spectroscopy.

