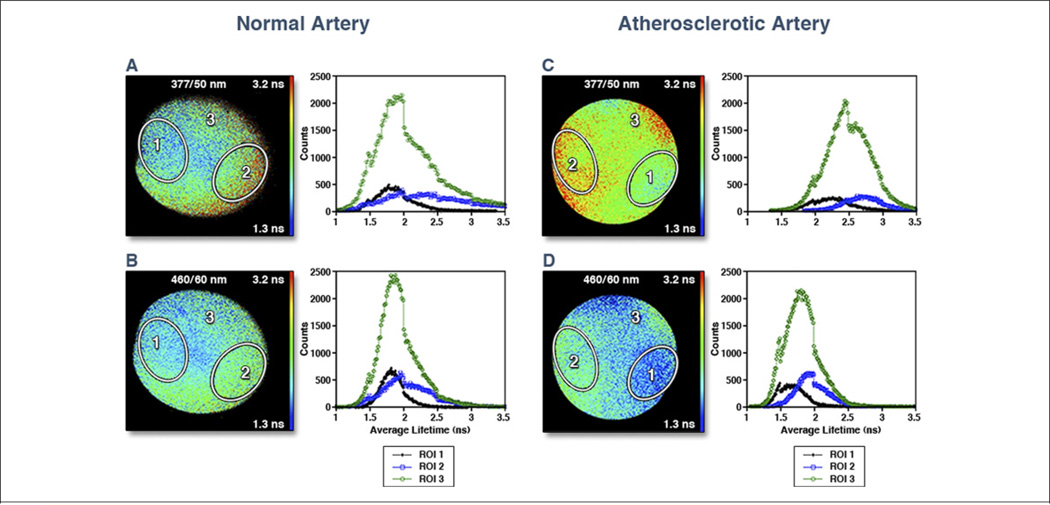
Figure 10. FLIM Images of Normal Artery.
Fluorescence lifetime imaging microscopy (FLIM) images of normal artery (thoracic aorta) (A) at 377/50 nm (center wavelength/bandwidth) and (B) at 460/60 nm. Note the uniformly ~2 ns average lifetimes, characteristics of elastin fluorescence emission. Images of an atherosclerotic artery (aorta) at (C) 377/50 nm and at (D) 460/60 nm. Note the longer lifetimes in C, which is a characteristic of collagen fluorescence, and the shorter lifetimes in D, which is a characteristic of lipid fluorescence, indicating that the plaque includes both collagen-rich areas (region-of-interest [ROI] 2) and lipid-rich areas (ROI 1). Histograms depicted to the right of the FLIM images correspond to those images. Black line indicates ROI 1, blue line indicates ROI 2, and green line indicates ROI 3. Reprinted with permission from Marcu (142).

