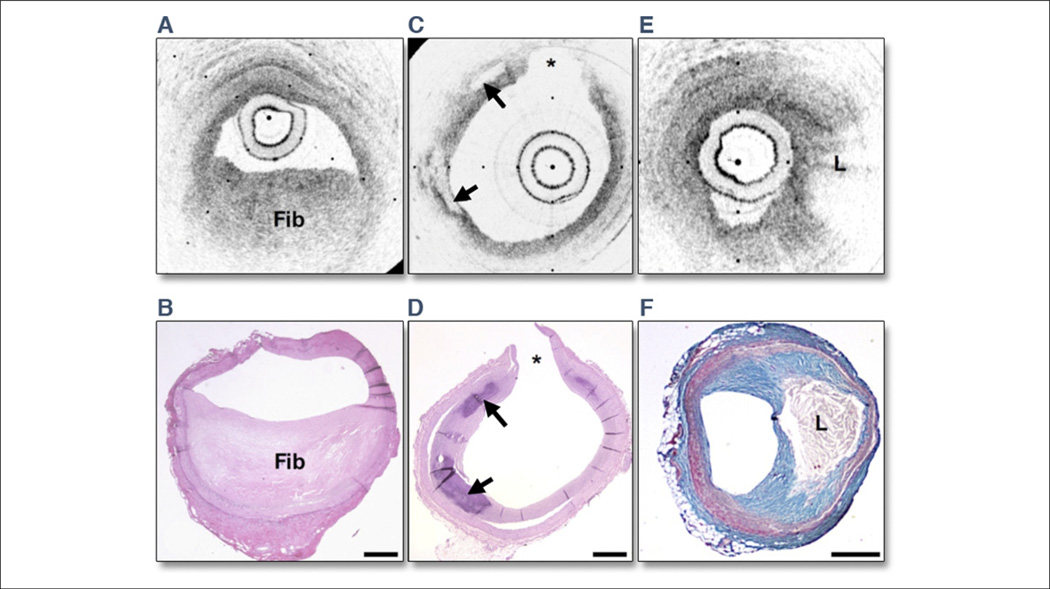
Figure 3. OCT Images and Corresponding Histology.
Optical coherence tomography (OCT) images and corresponding histology for (A, B) fibrous plaque type, (C, D) calcific plaque type, and (E, F) lipid-rich plaque type. In fibrous plaques (A, B), the optical coherence tomography (OCT) signal (Fib) is observed to be strong and homogenous. In comparison, both calcific regions (arrows) (C, D) and lipid-rich regions (L) (E, F) appear as signal-poor regions within the vessel wall. Lipid-rich plaques have diffuse or poorly demarcated borders whereas the borders of calcific nodules are sharply delineated. (B, D, hematoxylin and eosin; F, Masson’s trichrome; original magnification ×40.) Scale bars, tick marks = 500 µm. *Indicates a side branch. Reprinted with permission from Tearney et al. (25).

