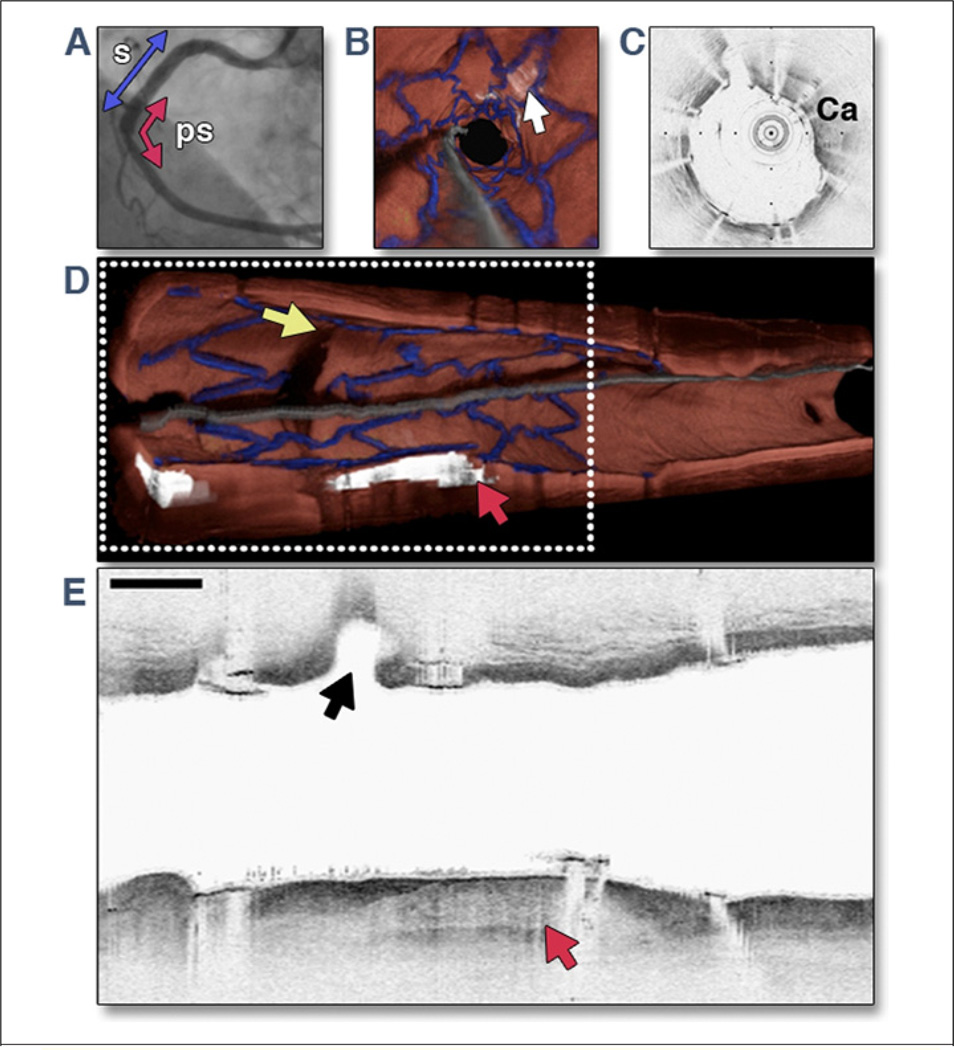
Figure 5. OFDI Images Obtained From Right Coronary Artery of a Patient Immediately After Deployment of DES.
The 3.0 cm optical frequency domain imaging (OFDI) pullback was obtained during a lactated Ringers’ solution flush at 3.0 ml/s. Images were acquired at 100 frames/s, with a pullback speed of 5.0 mm/s, resulting in an image-to-image pitch of 50 µm. (A) A left anterior oblique angiogram after drug-eluting stent (DES) deployment shows stent site (s) (blue arrow) and 3.0 cm OFDI pullback segment (ps) (red arrow). (B) Fly-through view (distal-proximal) demonstrates a calcified lesion underneath the stent (arrow). (C) An OFDI cross-sectional image, obtained at the location of yellow arrow in B, shows a large calcific (Ca) nodule from 11-o’clock to 4-o’clock. (D) Perspective cutaway view of entire 3-dimensional volume-rendered OFDI data set (left is proximal; right is distal), demonstrating the stent (blue), a side branch (yellow arrow), and a large calcific nodule (red arrowhead). (E) Longitudinal section through a portion of the dataset, corresponding to the gray dotted rectangle in D. The side branch (black arrow) and calcific nodule (red arrow) are evident. Scale bar and tick marks represent 1 mm. Modified with permission from Tearney et al. (90).

