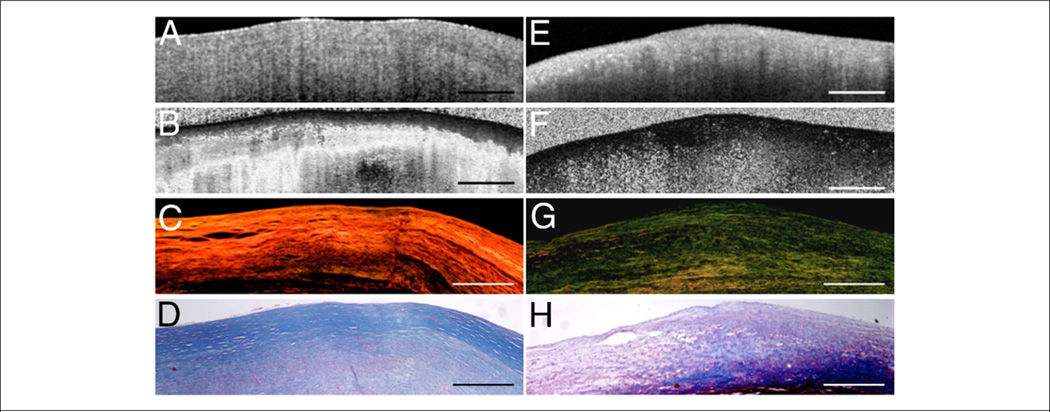
Figure 6. OCT Images and Corresponding Histopathology Demonstrating Collagen Birefringence In Atherosclerotic Plaques.
(A and E) Optical coherence tomography (OCT) images of fibrous plaques. (B) Polarization sensitive (PS)-OCT image of the fibrous plaque in A showing high birefringence as seen by the rapid transition of the image from black to white, corresponding to 0° to 180° phase retardation. (C) Picrosirius red stained histology section showing orange-red fibers (thicker fibers) under polarized light microscopy. (D and H) Trichrome stained histology images. (F) PS-OCT image of fibrous plaque showing black region corresponding to low birefringence below the luminal surface. (G) Corresponding picrosirius red stained histology section showing yellow-green fibers (thinner fibers) under polarized light microscopy. Scale bars = 500 µm. Reprinted with permission from Nadkarni et al. (37).

