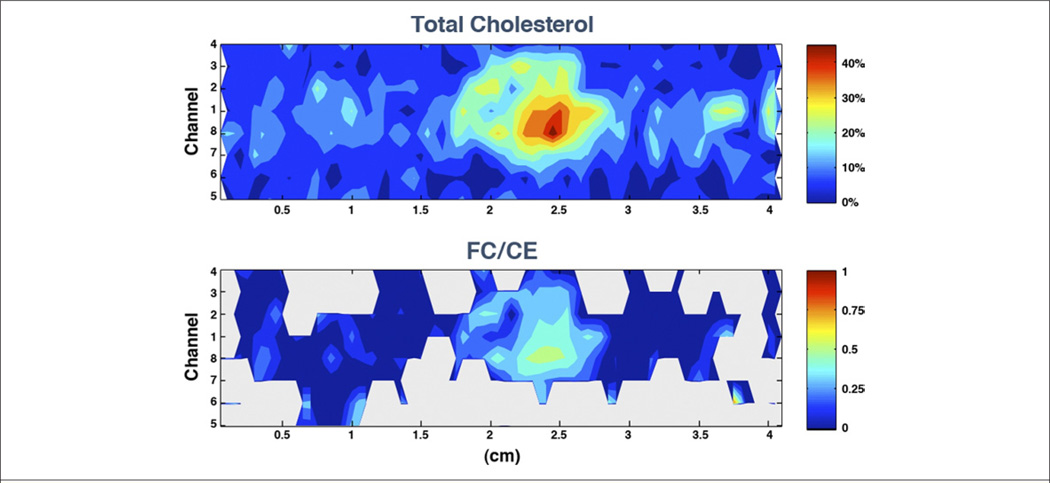
Figure 9. Chemical Concentrations Within a Human Coronary Artery Determined Using Intravascular Catheter System Based on Raman Spectroscopy.
(Upper Panel) The upper contour map shows the total cholesterol concentrations throughout the artery segment. (Lower Panel) The lower graph displays the nonesterified-cholesterol to cholesterol ester (FC/CE) ratio, calculated when the amount of total cholesterol was estimated to be above 5% (gray otherwise). The plot abscissa indicates the length along the sample, while the ordinate indicates which fiber sensor in the catheter is recording information along a given row. The large increase in the FC content within the focal deposit centered ~2.5 cm suggests the presence of a necrotic core containing crystalline cholesterol. Figure courtesy of James Brennan.

