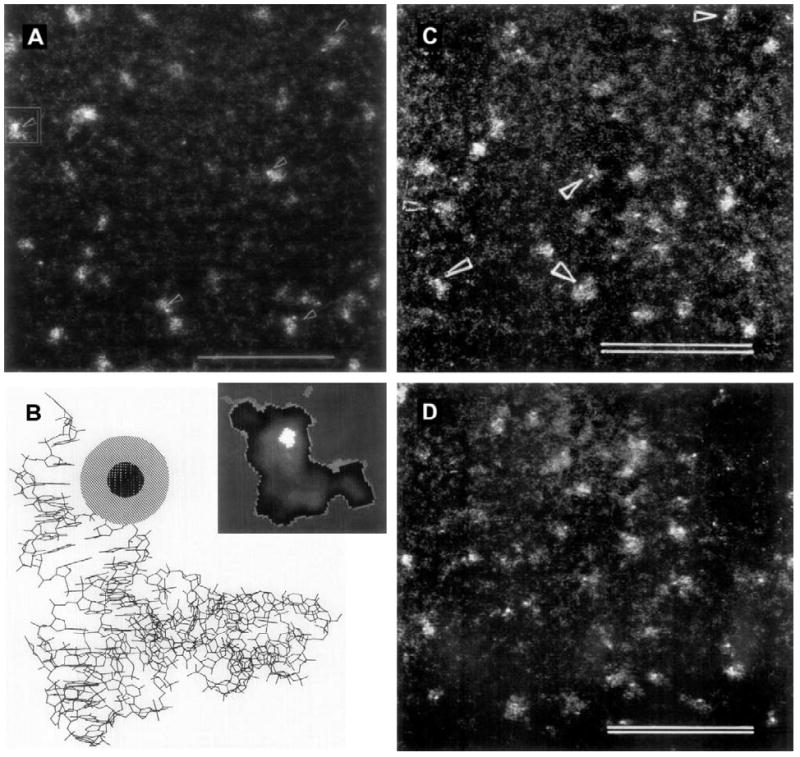
Fig. 1.

Scanning transmission electron microscopy (STEM) with undecagold-labeled Phe-tRNA(Phe). (A) STEM micrograph of freeze-dried unstained molecules of yeast Phe-tRNA(Phe) derivatized at position 75 using maleimido undecagold; particles with the undecagold label are denoted by arrows (scale bar = 50 nm). (B) Structure of Phe-tRNA(Phe) from X-ray crystallography data (Sussman et al., 1978), with undecagold cluster schematically inserted at position 75. Inset: StEM image of a single yeast Phe-tRNA(Phe) molecule (framed in (A)) smoothed by low pass filtering and displayed in simulated colors: the bright area represents the undecagold cluster. (C) STEM micrograph of freeze-dried unstained molecules of Phe-tRNA(Phe) labeled with an undecagold cluster on acp3U47, denoted by arrowheads (scale bar = 50 nm). (D) Freeze-dried unstained particles of the ternary complex of acp3U47 undecagold-labeled Phe-tRNA(Phe) with T. thermophilus EF Tu.GTP (scale bar = 50 nm). (A and B) From Hainfeld et al., 1991; (C and D) from Blechschmidt et al. (1993) (used with permission).
