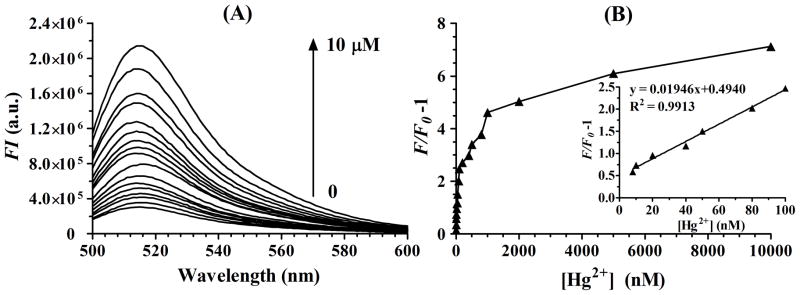
Figure 2.

(A) Fluorescence emission spectra (excitation at 480 nm, emission at 518 nm) of probes solution on adding increasing concentrations of Hg2+ (0, 5 nM, 8 nM, 10 nM, 20 nM, 40 nM, 50 nM, 80 nM, 100 nM, 200 nM, 400 nM, 500 nM, 800 nM, 1 μM, 2 μM, 5 μM, 10 μM). (B) Plot of (F/F0−1) as function of the same concentrations of Hg2+ as (A), where F0 and F are the FAM fluorescence intensity in the absence and the presence of Hg2+. Inset: Linear fit plot of (F/F0−1) as function of the increasing concentrations of Hg2+ from 8 nM to 100 nM.
