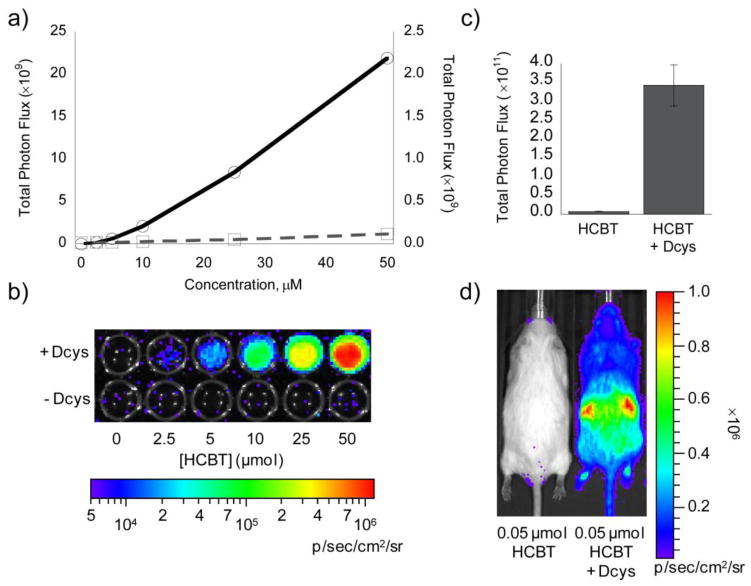
Figure 3. Determination of bioluminescent signal from endogenous L-cysteine.
(a) Total photon flux, integrated over 2 h, from PC3M-luc cells with HCBT (0–50 μM) in the presence (solid line, y1 axis) or absence (dashed line, y2 axis) of D-cysteine (0–50 μM) in HBSS (25 mM glucose). (b) Representative image of PC3M-luc cells with HCBT ± D-cysteine, log scale. (c) Total photon flux, 0–60 min post-injection, for mice injected with D-cysteine (0.05 μmol in 20 μL PBS) or vehicle (20 μL PBS) and HCBT (0.05 μM in50 μL 1:1 DMSO:PBS). (d) Representative image (30 min post-injection) of mice injected with HCBT ± D-cysteine. Error bars are ±SEM; A: n = 3, C: n = 3–4.

