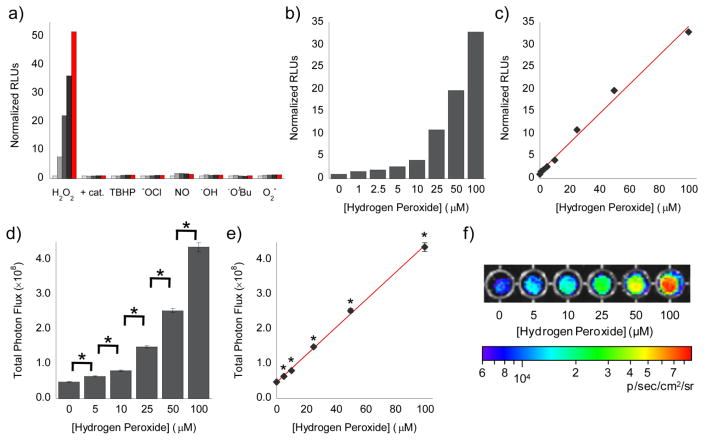
Figure 5. Selective and concentration-dependent bioluminescent detection of H2O2 by PCL-2.
(a) Total bioluminescent signal, integrated over 10 min, from PCL-2 (5 μM) alone (light grey bars) or incubated with various ROS (100 μM) or H2O2 (100 μM) and catalase (0.4 mg/mL) for 5, 20, 40, or 60 min. Signals normalized to signal from PCL-2 in the absence of any ROS. (b) Total bioluminescent signal, integrated over 15 min, from 5 μM PCL-2 incubated for 1 h with increasing concentrations of H2O2 (0–100 μM). To measure HCBT release in a and b, PCL-2/ROS solutions were incubated with D-cysteine (20 μM) for 15 min, prior to addition of 100 μg/mL luciferase in 50 mM Tris buffer with 10 mM MgCl2, 0.1 mM ZnCl2, and 2 mM ATP (pH 7.4). (c) Line graph representation of b, which indicates a linear increase (R2 = 0. 9957) in bioluminescent signal from PCL-2 in the presence of H2O2 in aqueous solution. (d) Total photon flux, integrated over 2 h, from PC3M-luc cells with PCL-2 (25 μM), D-cysteine (25 μM), and H2O2 (0–100 μM) in DMEM. (e) Line graph representation of d, which indicates a linear increase (R2 = 0.9993) in bioluminescent signal from PCL-2 in the presence of H2O2 in PC3M-luc cells. (f) Representative image of PC3M-luc cells with PCL-2, D-cysteine, and H2O2 in DMEM, log scale. Statistical analyses were performed with a two-tailed Student’s t-test. *P < 0.01 (D and E: n = 6) and error bars are ±SEM.

