
Figure 6. Selective and sensitive bioluminescent detection of Caspase 8 activity by IETDC.
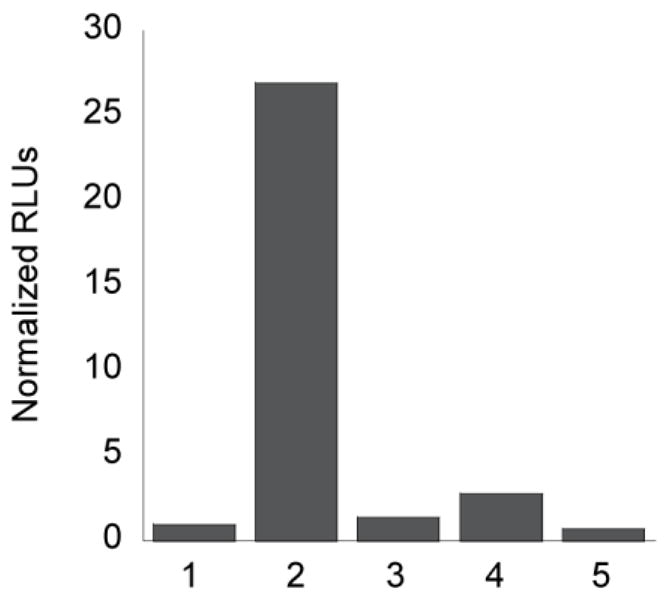
(a) Total bioluminescent signal, integrated over 10 min, from IETDC (5 μM) and HCBT (5 μM) alone or incubated with various caspase enzymes (3 and 8: 1 unit; 9: 0.001 unit) or caspase 8 and Q-VD-OPh (10 μM) for 60 min. From left to right, 1: IETDC and HCBT; 2: IETDC, HCBT, and caspase 8; 3: IETDC, HCBT, caspase 8, and Q-VD-OPh; 4: IETDC, HCBT, and caspase 3; 5: IETDC, HCBT, and caspase 9. Signals normalized to signal from IETDC and HCBT in the absence of the caspase enzymes. To quantify luciferin formation, 100 μg/mL luciferase in 50 mM Tris buffer with 10 mM MgCl2, 0.1 mM ZnCl2, and 2 mM ATP (pH 7.4) was added to 100 μL of each IETDC/HCBT solution.