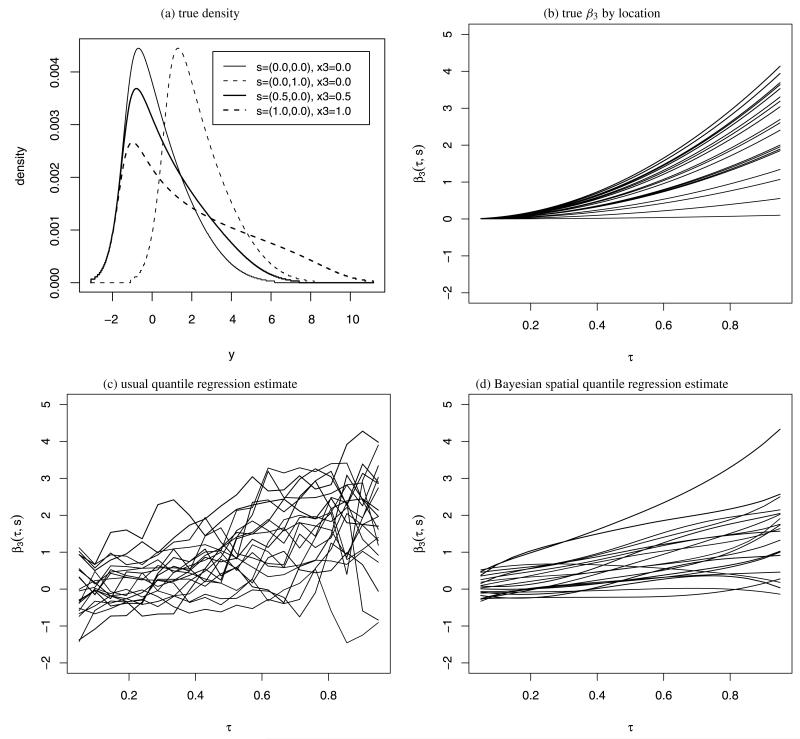
Figure 1.
True and estimated quantile curves for the simulation study. Panel (a) gives the true density as a function of space and covariates, panel (b) plots the true quantile function β3(s,τ), panel (c) plots the usual quantile estimate for one dataset, and panel (d) plots the posterior mean from spatial quantile regression for one dataset.

