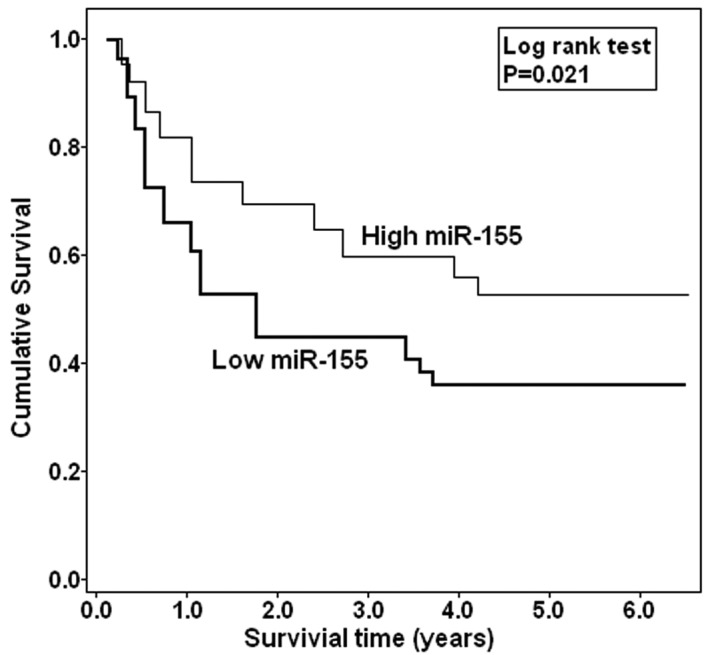
Figure 2.

Survival curves of EOC patients according to the status of miR-100 expression. Patients with low miR-100 expression (n=50) showed significantly poorer prognosis than those with high miR-100 expression (n=48) (P=0.021; log-rank test).

Survival curves of EOC patients according to the status of miR-100 expression. Patients with low miR-100 expression (n=50) showed significantly poorer prognosis than those with high miR-100 expression (n=48) (P=0.021; log-rank test).