Figure 2.


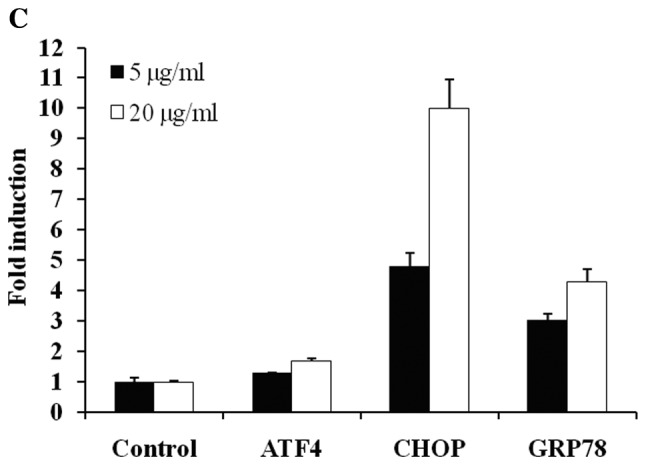
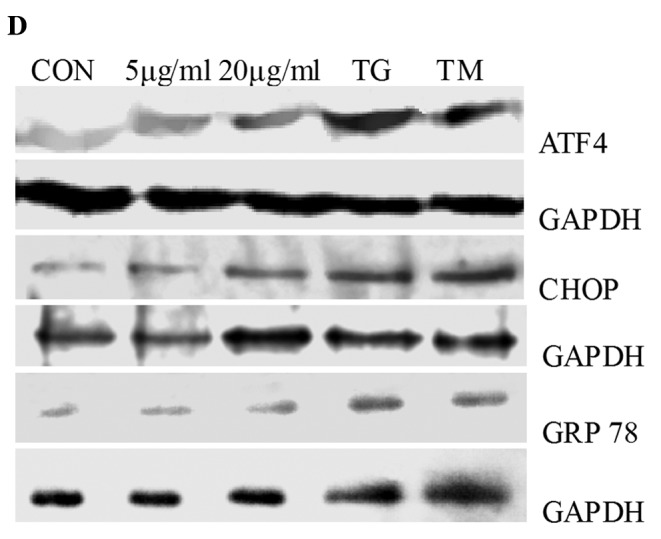
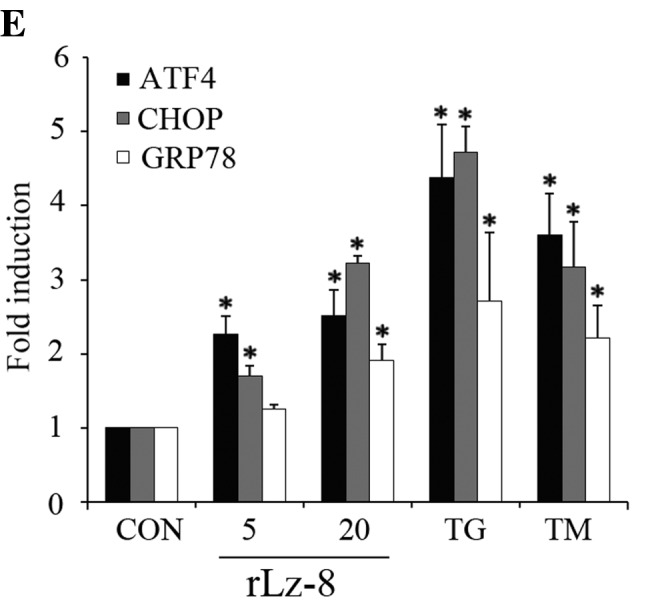
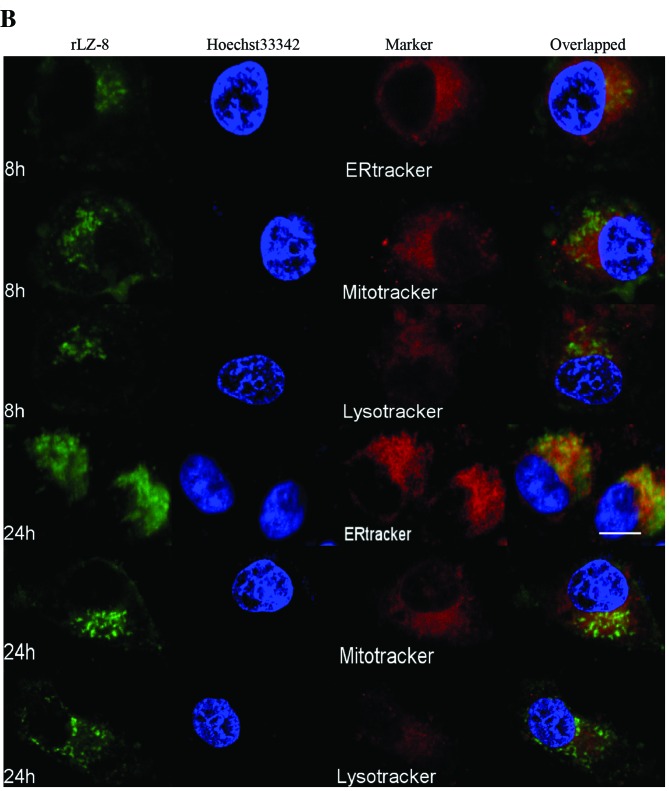
Localization of rLz-8 and induction of ER stress in cells treated with rLz-8. (A) rLz-8- FITC (5 μg/ml) accumulating in cells for several time courses. Scale bar: 10 μm. (B) Intracellular localization of rLz-8. SGC7901 cells treated with rLz-8-FITC for 24 h. After treatment, the rLz-8 localization was examined by using Hochest 33342 (1 μg/ml) for nucleus (blue) and various subcellular makers such as ERtracker (red) for ER, Mitotracker (red) for mitochondria, Lysotracker (red) for lysosome. Scale bar: 10 μm. (C) Gene expression of ER stress induced by rLz-8. SGC7901 cells treated with rLz-8 (5 or 20 μg/ml d) and incubated for 24 h. Relative mRNA levels were measured by real-time qPCR, n=3. (D) Protein levels of ATF4 (38 kDa), CHOP (30 kDa) and GRP78 (78 kDa) were measured by Western blot analysis. SGC7901 cells were treated for 24 h with 5 μg/ml rLz-8, 20 μg/ml rLz-8, 300 nM thapsigargin (TG), and 2 μg/ml tunicamycin (TM). (E) Quantitative analysis of intensities of Western blotting. CON, control. Standard error represents three independent experiments. P-value represents the significant difference between conditions at *P<0.05.

