Figure 3.

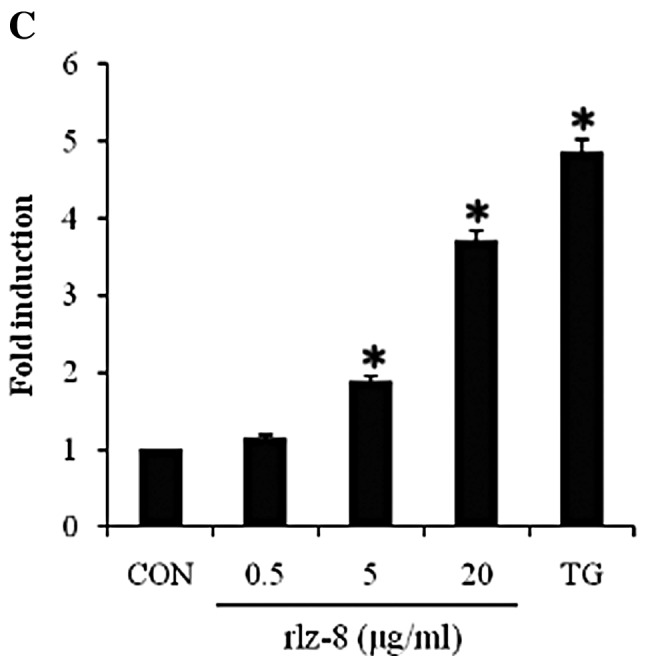
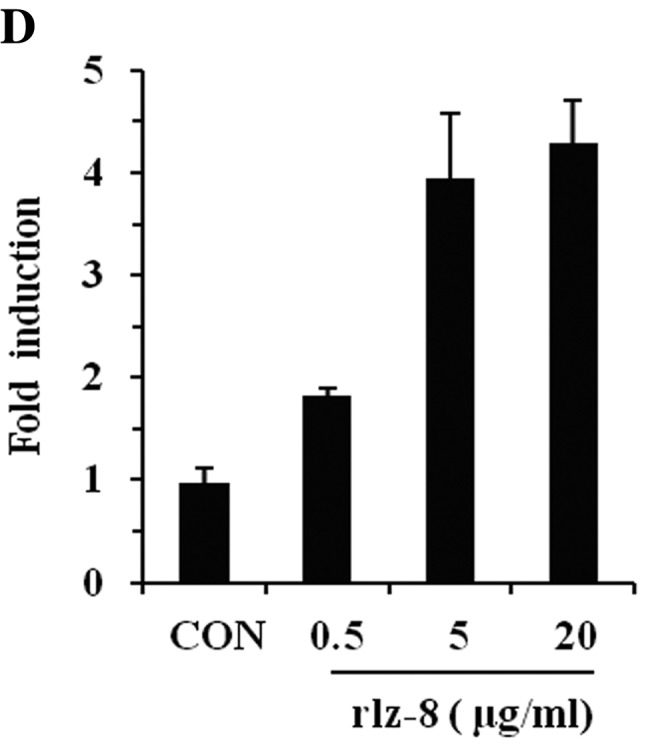
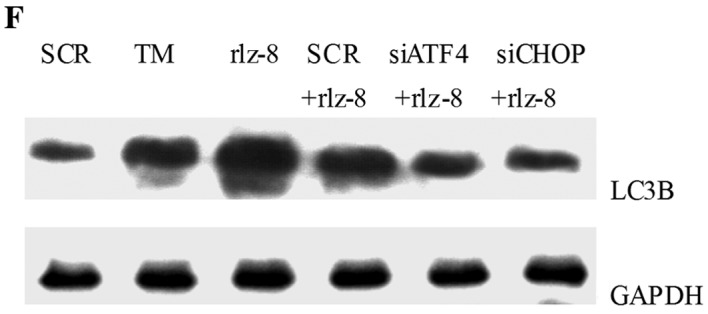
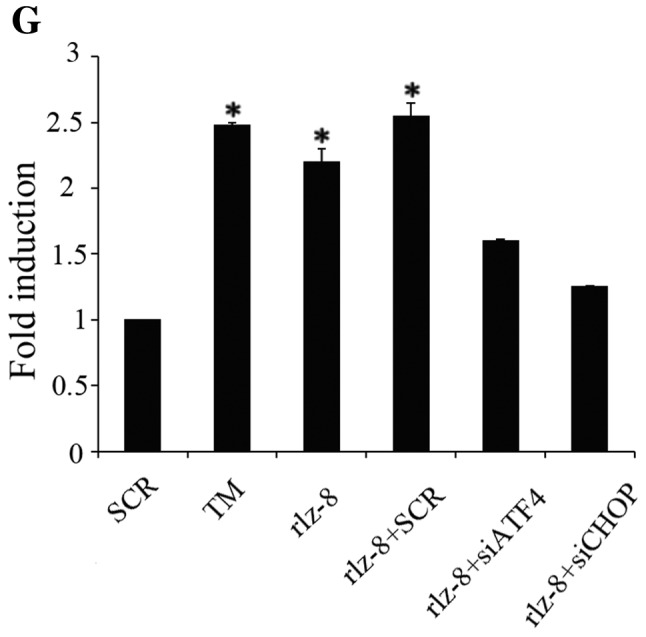
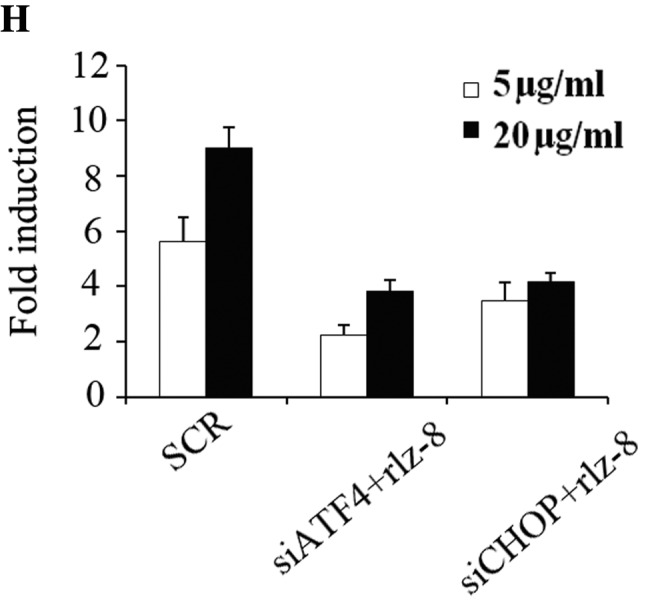
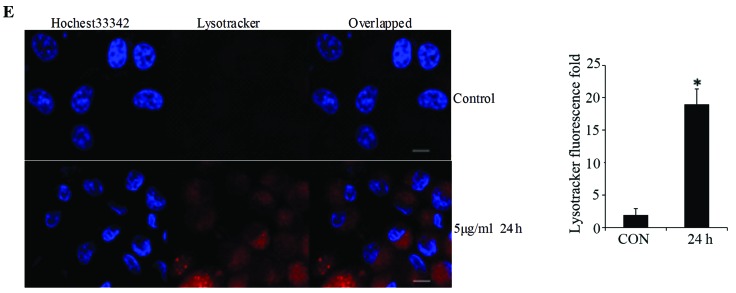
Induction of autophagy in SGC7901 cells treated with rLz-8. (A) Electron micrographs were taken of SGC7901 cells untreated (a) or treated (b) with 2 μg/ml tunicamycin (TM) for 24 h, (c) 300 nM thapsigargin (TG) for 24 h, (d) 5 μg/ml and (e) 20 μg/ml rLz-8 for 48 h. Double membrane vacuoles are denoted by an arrow, and the nucleus is denoted by N. Scale bar: 1 μm. The histogram is the numbers of autophagosomes in SGC7901 cells after exposure to the indicated stimuli for 24 h. A total of 25 electron microscopic sections were prepared. Standard error represents 3 independent experiments. P-value represents the significant difference between conditions at *P<0.05. (B) Protein levels of LC3B (15 kDa) were measured by immunoblot analysis. SGC7901 cells were treated for 24 h with 300 nM thapsigargin (TG), 0.5, 5, and 20 μg/ml rLz-8. (C) Quantitative analysis of intensities of Western blotting. CON, control. Standard error represents 3 independent experiments. P-value represents the significant difference between conditions at *P<0.05. (D) Gene expression of LC3B induced by rLZ-8. SGC7901 cells treated with 0.5, 5, and 20 μg/ml rLz-8 for 24 h. Relative mRNA levels were measured by real-time qPCR, n=3. CON, control. (E) Induction of lysosomes in SGC7901 cells treated with rLz-8. SGC7901 cells were treated with 5 μg/ml of rLz-8 for 24 h. Nuclear stained with Hoechst 33342 (blue) and Lysotracker (red) staining are shown. The histogram is quantitative analysis of fluorescence intensities. Scale bar: 10 μm. (F) Protein levels of LC3B (15 kDa) were measured by immunoblot analysis. Cells were RNAi against control (SCR), ATF4 and CHOP. After 24 h, cells were treated with 5 μg/ml rLz-8 for 24 h. (G) Quantitative analysis of intensities of Western blotting. CON, control. Standard error represents three independent experiments. P-value represents the significant difference between conditions at *P<0.05. (H) Gene expression of LC3B with siRNA. Cells were RNAi against control (SCR), ATF4 and CHOP. Cells were treated 24 h later with 5 μg/ml or 20 μg/ml rLz-8 for 24 h. Relative mRNA levels were measured by real-time qPCR, n=3.


