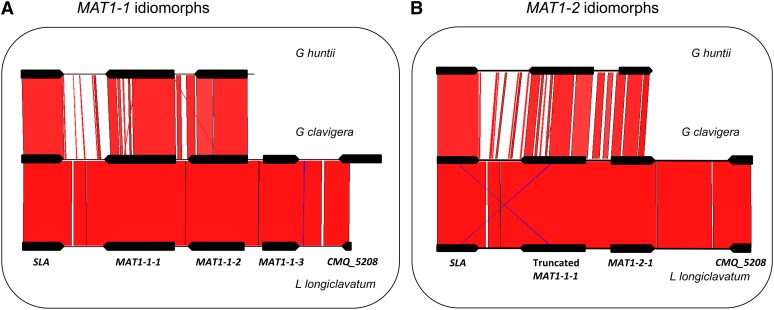
Figure 3 .
Homology among the MAT locus. (A) MAT1-1 idiomorph; (B) MAT1-2 idiomorph, of G. huntii, G. clavigera, and L. longiclavatum. The diagram was prepared from the output of Artemis Comparison Tool. Regions of strong homology are shaded and connected by lines. The intensity of shading indicates the strength of homology. Genes are represented by box arrows. The MAT1-2 sequence of G. clavigera SL-KW1407 was obtained from the genome sequence, while the MAT1-1 sequence of G. clavigera and opposite MAT isolates of other fungi were obtained in this investigation.

