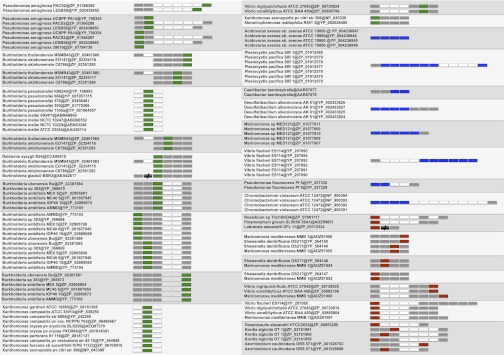
Figure 5 .

Evolutionary inference of Reb homologs based on phylogenetic analysis of the 203 Reb homologs (Figure S1). Here we have highlighted a few of the monophyletic groups. For each taxon, the genome locations of the corresponding Reb proteins are shown. Reb homologs highlighted in green are orthologs that were inferred to have been inherited through speciation events; those highlighted in blue represent paralogs issued from species-specific gene duplications; and those in red are the Reb homologs that have likely originated via horizontal transfer. Adjacent reb genes are indicated in gray. Open reading frames between reb genes are shown in white, and black slash-like symbols represent large intervening regions between reb genes.
