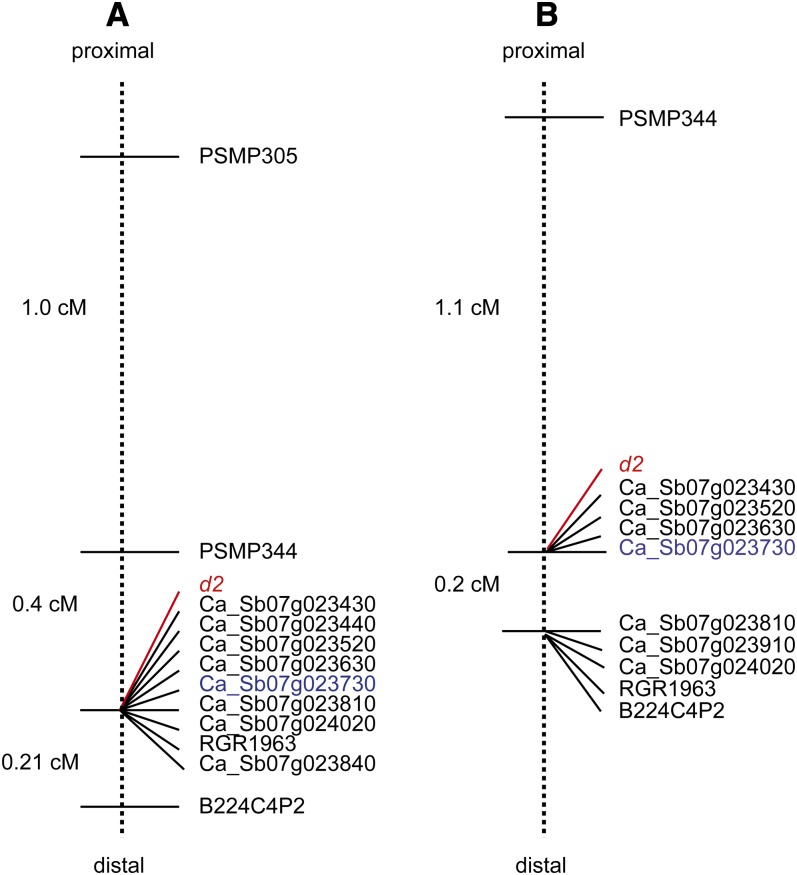
Figure 2 .
Genetic map of the d2 region on linkage group 4 of pearl millet generated in (A) the Tift 23DB × ICMP 451 mapping population and (B) the PT 732B × P1449-2 mapping population. The map position of the d2 phenotype is indicated in red. The map position of the sorghum dw3 ortholog (Ca_Sb07g023730) is indicated in blue.

