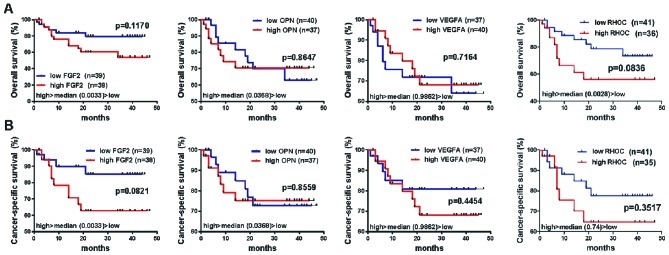
Figure 5.

Kaplan-Meier curves depicting overall (A) and cancer-specific (B) survival (%) of the urinary bladder cancer patients, as regards the expression of the four angiogenic components (77 patients). Survival differences were assessed using the log-rank test. Statistical significance was set at the 95% level (P<0.05).
