
Figure 4.
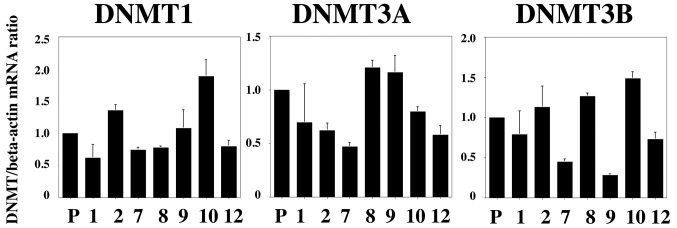
Quantitative real-time RT-PCR analyses of DNMT mRNA levels in the SN38-resistant subclones. Quantitative real-time RT-PCR analyses were carried out for three DNMT genes: DNMT1, DNMT3A and DNMT3B. The cells indicated as P, 1, 2, 7, 8, 9, 10 and 12 at the bottom of the figures are parent, SN38r1, SN38r2, SN38r7, SN38r8, SN38r9, SN38r10 and SN38r12 cells, respectively.