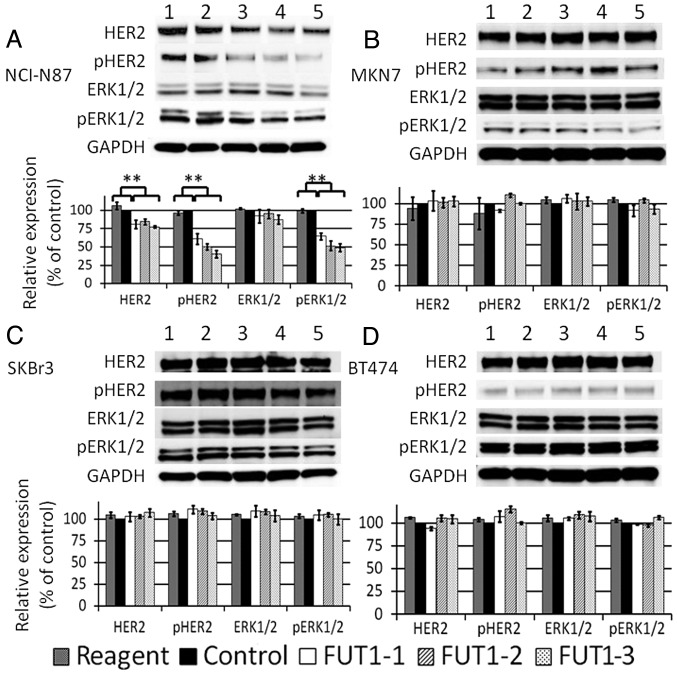
Figure 5.
The effect of downregulating FUT1 on protein expression and tyrosine phosphorylation of HER2 and ERK1/2 under EGF-stimulated condition. The bar chart shows the relative expression ratio of each protein found by western blotting. Each value is calculated as the ratio of signal intensity compared to that of control. Data were normalized to signal intensity of glyceraldehyde 3-phosphate dehydrogenase (GAPDH). Lane 1, reagent; lane 2, control; lane 3, FUT1-1; lane 4, FUT1-2; and lane 5, FUT1-3. (A) NCI-N87, (B) MKN7, (C) SKBr3 and (D) BT474 cells. **P<0.05.

