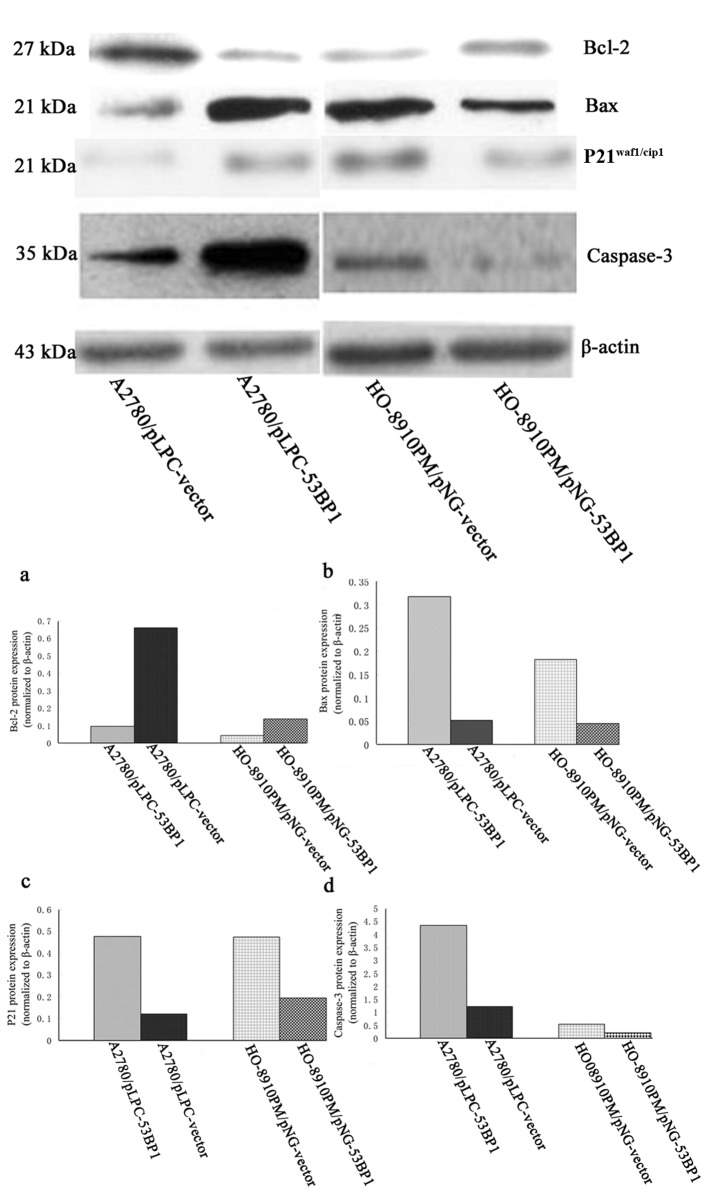
Figure 6.
(A) Western blot assay of P21waf1/Cip1, caspase-3, Bax and Bcl-2 protein levels in the three cell lines. (B) Semi-quantitative analysis of (a) Bcl-2, (b) Bax, (c) P21waf1/Cip1 and (d) caspase-3. The protein levels were normalized to β-actin and compared with the control of three independent experiments.

