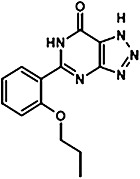
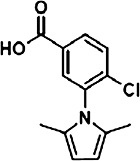
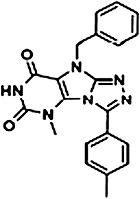
TABLE 1.
Characterization of novel GPR35 agonists
The chemical structures of compounds 1–5 are shown as are pEC50 and Emax values obtained in the various assays employed.
| Zaprinast | Compound 1 | Compound 2 | Compound 3 | Compound 4 | Compound 5 | |||
|---|---|---|---|---|---|---|---|---|
 |
 |
 |
 |
 |
 |
|||
| PathHunter β-arrestin | Hu GPR35 | pEC50 | 5.1 ± 0.01 | 7.6 ± 0.05 | 6.3 ± 0.05 | 5.4 ± 0.11 | 5.6 ± 0.01 | 4.9 ± 0.07 |
| Max | 100.0 ± 0.00 | 95.3 ± 2.24 | 98.3 ± 5.22 | 105.0 ± 9.95 | 101.8 ± 8.75 | 72.0 ± 5.58 | ||
| PathHunter (Gqi5) | Hu GPR35 | pEC50 | 6.0 ± 0.34 | 8.5 ± 0.05 | 6.0 ± 0.04 | 5.5 ± 0.10 | 4.9 ± 0.03 | 6.2 ± 0.09 |
| Max | 1.7 ± 0.05 | 1.6 ± 0.05 | 1.7 ± 0.02 | 1.8 ± 0.06 | 1.5 ± 0.03 | 1.6 ± 0.01 | ||
| BRET β-arrestin | Hu GPR35 | pEC50 | 5.6 ± 0,03 | 7.6 ± 0.03 | 5.5 ± 0.04 | 5.5 ± 0.03 | 4.9 ± 0.06 | 4.7 ± 0.04 |
| Max | 100 ± 1.35 | 100.2 ± 1.32 | 96.1 ± 1.81 | 123.0 ± 1.98 | 104.3 ± 4.25 | 134.4 ± 4.10 | ||
| Mu GPR35 | pEC50 | 6.6 ± 0.04 | 4.78 ± 0.05 | <4 | <4 | 4.7 ± 0.16 | 4.0 ± 0.24 | |
| Max | 101.1 ± 1.53 | 61.7 ± 2.52 | — | — | 68.1 ± 7.97 | 109.4 ± 32.7 | ||
| Rat GPR35 | pEC50 | 7.1 ± 0.04 | 5.1 ± 0.08 | <4 | <4 | 4.3 ± 0.09 | 4.9 ± 0.05 | |
| Max | 100.0 ± 1.67 | 36.0 ± 1.53 | — | — | 88.4 ± 8.00 | 116.9 ± 3.8 | ||
| Inositol phosphate (Gαqα13) | Hu GPR35 | pEC50 | 6.9 ± 0.06 | 8.1 ± 0.09 | 6.5 ± 0.06 | 6.8 ± 0.07 | 5.6 ± 0.10 | 6.0 ± 0.10 |
| Max | 99.0 ± 2.87 | 86.0 ± 3.53 | 100.9 ± 3.1 | 84.1 ± 4.63 | 96.8 ± 5.60 | 92.5 ± 5.18 | ||
| Mu GPR35 | pEC50 | 7.9 ± 0.60 | 5.6 ± 0.09 | 4.5 ± 0.14 | <4 | 6.0 ± 0.08 | 5.0 ± 0.16 | |
| Max | 99.3 ± 5.49 | 133.7 ± 6.08 | 197.0 ± 20.7 | — | 107.3 ± 3.80 | 101.4 ± 11.02 | ||
| Rat GPR35 | pEC50 | 8.3 ± 0.42 | 5.6 ± 0.10 | 4.5 ± 0.14 | <4 | 5.8 ± 0.11 | 5. ± 0.93 | |
| Max | 97.9 ± 6.36 | 110.6 ± 6.29 | 197.2 ± 21.3 | — | 92.9 ± 5.81 | 105.5 ± 4.96 |
Hu, human; Mu, mouse.
