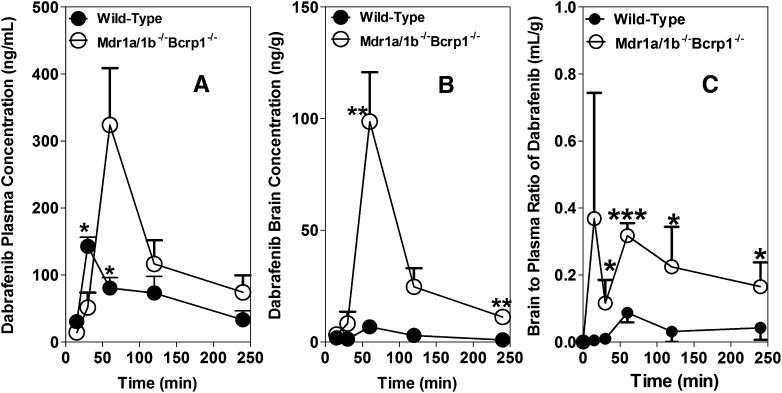
Fig. 6.
Brain distribution of dabrafenib in FVB wild-type and Mdr1a/b−/−Bcrp1−/− mice after an oral dose. Plasma (A) and brain (B) concentration versus time profiles, and brain-to-plasma concentration ratios (C) of dabrafenib in wild-type and Mdr1a/b−/−Bcrp1−/− mice after an oral dose of 25 mg/kg. Plasma and brain concentrations were determined using LC-MS/MS at 15, 30, 60, 120, and 240 minutes postdose of dabrafenib. Data represent the mean ± S.D.; n = 3–4. *P < 0.05; **P < 0.001; ***P < 0.0001.

