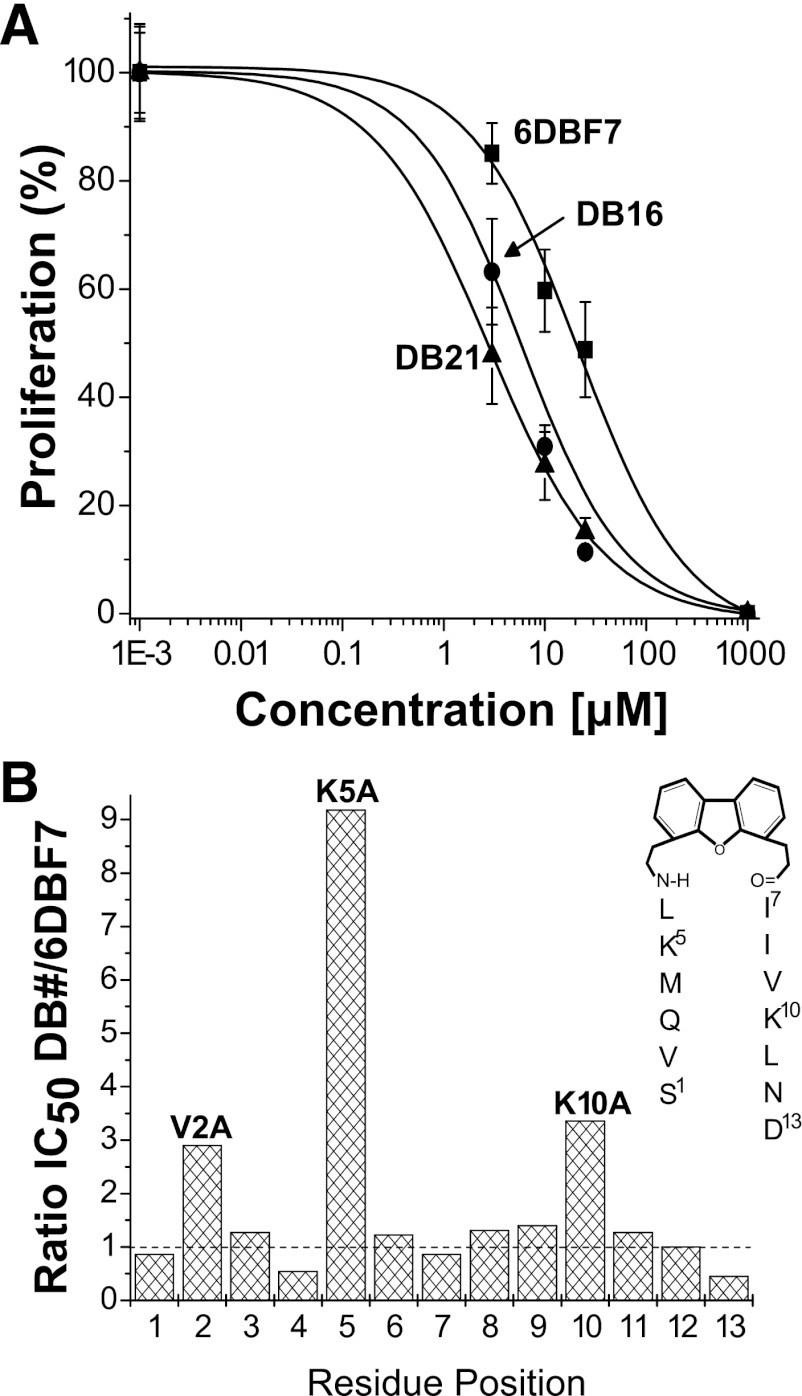
Fig. 2.
(A) EC proliferation data are exemplified with dose-response curves for DBF-based compounds 6DBF7, DB16, and DB21 as labeled. Proliferation of basic fibroblast growth factor–stimulated (10 ng/ml) HUVEC cultures was measured by colorimetric quantification. (B) EC proliferation results from alanine scanning of 6DBF7 are shown in bar graph format as the ratio of IC50 values (from Table 1) for DB analogs (DB1–DB13) divided by that of the parent 6DBF7. For reference, the chemical structure of 6DBF7 is shown as an inset.

