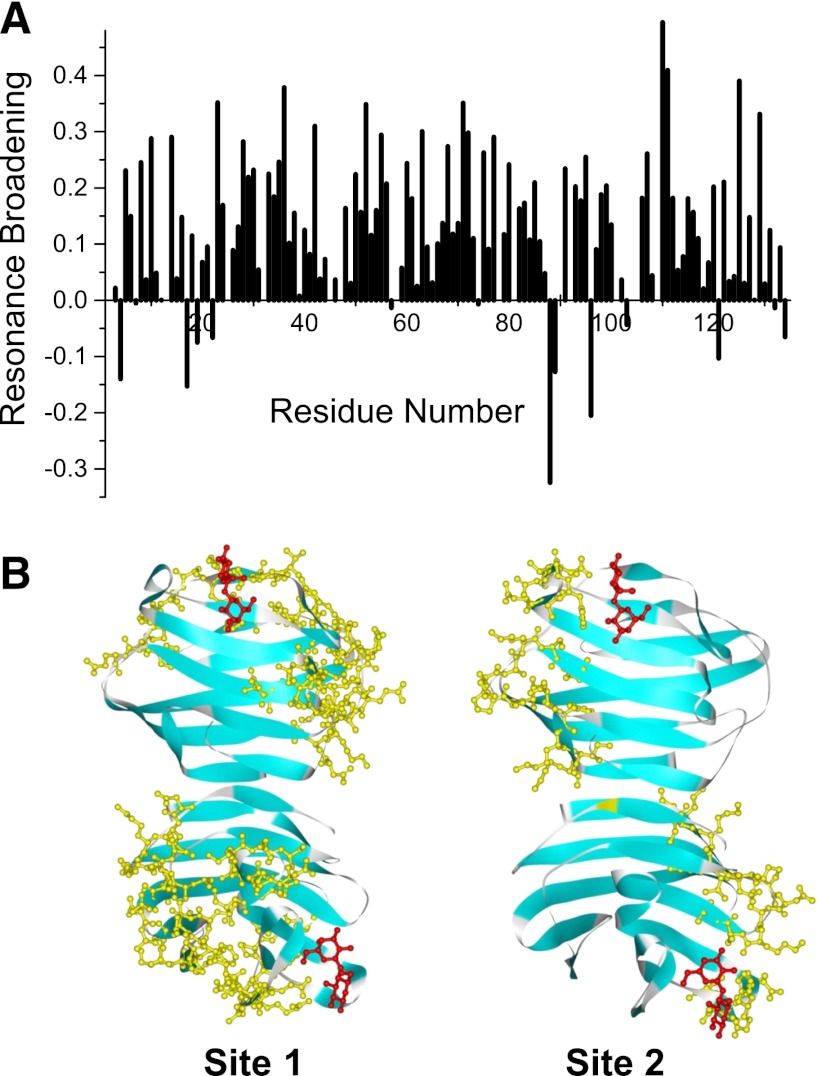
Fig. 3.
(A) Plot of intensity changes (apparent resonance broadening) versus the gal-1 amino acid sequence. Changes in resonance intensities (ΔI) were calculated as fractional changes by subtracting from one the intensity of a given HSQC cross peak divided by that from the sample of gal-1 alone, as described by Miller et al. (2009b). A value of +1 indicates that that resonance is no longer apparent, a value of zero indicates no change in resonance intensity, and a value of –1 indicates an increase in resonance intensity. (B) Gal-1 structure (PDB 1GZW) showing DB16 interacting residues highlighted in color.

