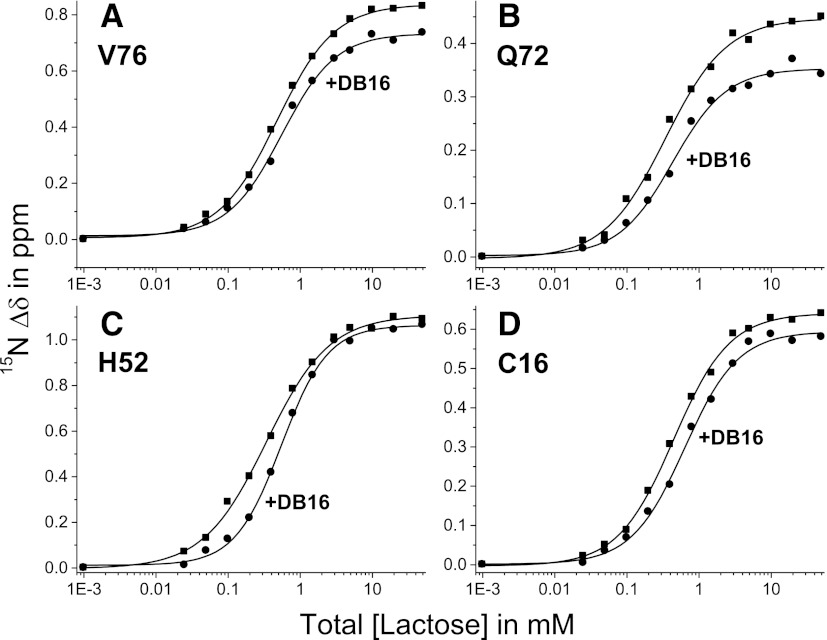
Fig. 4.
Lactose binding to gal-1. 15N-gal-1 (100 µM) HSQC-derived lactose binding curves acquired in the absence and presence of DB16 (gal-1:DB16 molar ratio of 1:6) are shown for four residues [(A) Val76, (B) Gln72, (C) His52, and (D) Cys16]. When corrected for gal-1–bound ligand, the midpoint of these curves indicates the actual Kd value (free ligand concentration). Kd values for the top 20 lactose-induced gal-1–shifted resonances were averaged as discussed in the text.

