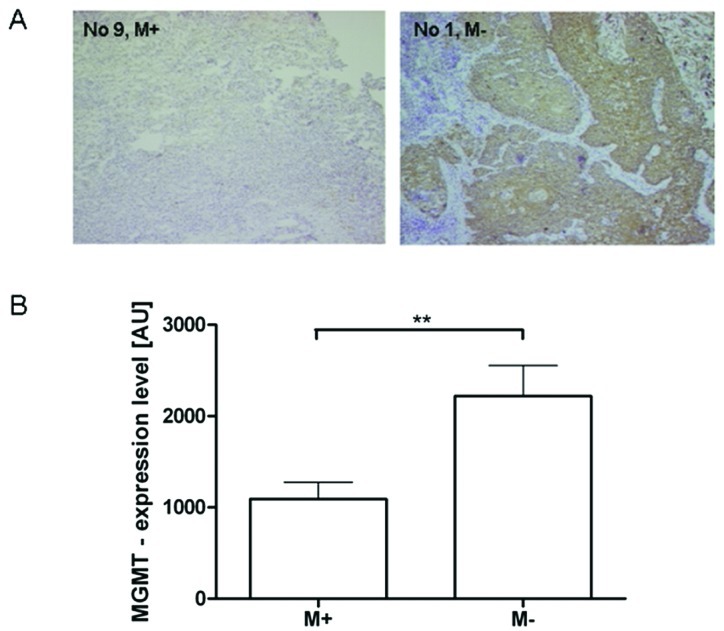
Figure 2.

The MGMT expression in tumor samples with a hypermethylated MGMT promoter region is significantly lower than that in tumor samples without hypermethylation of the MGMT promoter region. Shown are representative immunohistochemically analyzed samples (A, ×100). Mean values ± SD in arbitrary units (A.U). Differences were calculated by t-test; **p<0.01. M+, hypermethylated MGMT promoter region. M−, no hypermethylation of the MGMT promoter region.
