Figure 1.
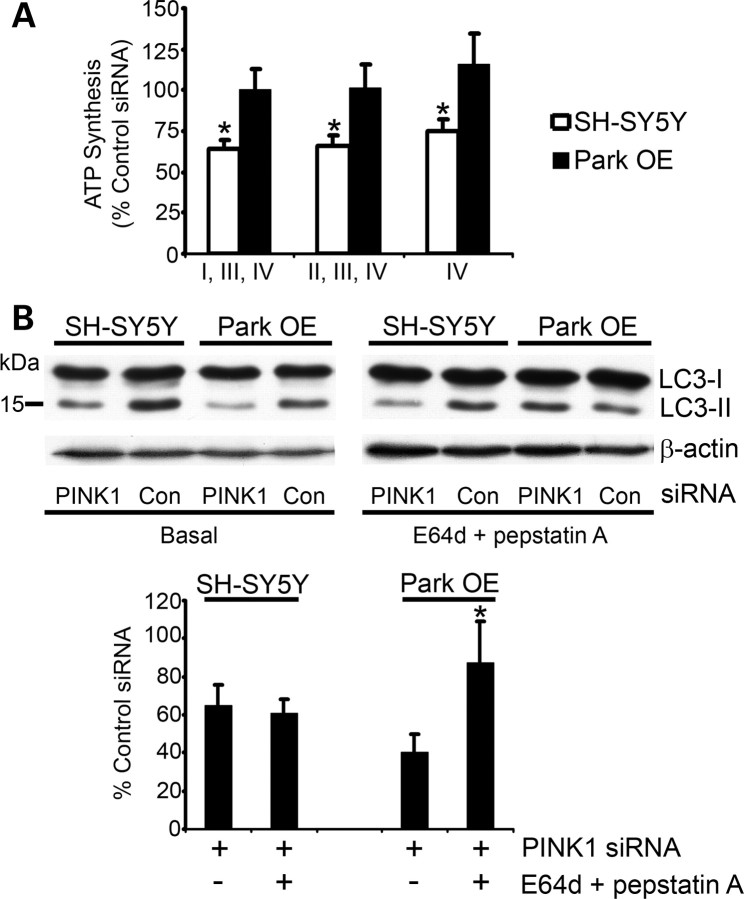
ATP synthesis and autophagy flux after 12 days of PINK1 silencing. SH-SY5Y cells or Park OE cells were transfected with PINK1 siRNA #2 or control siRNA for 12 days. (A) Cells were harvested by trypsinization, permeabilized with digitonin and incubated with glutamate + malate (complexes I, III, IV), succinate + rotenone (complexes II, III, IV) or ascorbate + TMPD (complex IV) at 37°C to measure ATP synthesis. ATP was measured by a luciferase assay and normalized to cell number. Data are expressed as % control siRNA ATP synthesis (mean ± SEM; n = 5). *P < 0.05 versus control siRNA. (B) Cell lysates were prepared from untreated cells (basal) or cells treated with the lysosomal inhibitors E64d and pepstatin A (both 10 μg/ml) for 3 h. Western blots were probed with LC3 antibody and equal protein loading was assessed using an antibody against β-actin. The density of bands was measured and the LC3-II/LC3-I ratio was normalized to β-actin. Data are expressed as % of control siRNA-treated cell lines under basal conditions or in the presence of lysosomal inhibitors (n = 5). *P < 0.05 versus ParkSH + siRNA under basal conditions.

