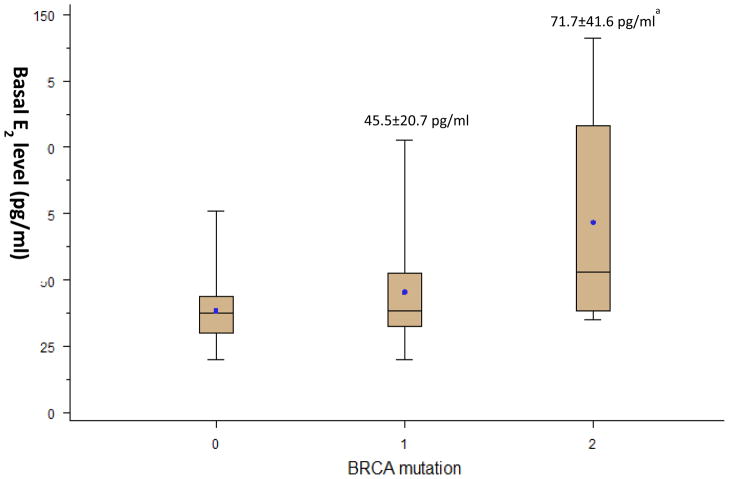
Fig. 1. Comparison of basal serum estradiol (E2) levels by BRCA mutation status.
The upper and lower T bars denote maximum and minimum values, respectively. The lines inside the plot boxes denote median values and dots denote mean values. The numbers above the upper T bars denotes “mean baseline serum E2 levels ± standard deviation” in each group.
ap<0.017 compared to BRCA(−) group analyzed by multiple comparisons with a Bonferroni adjustment

