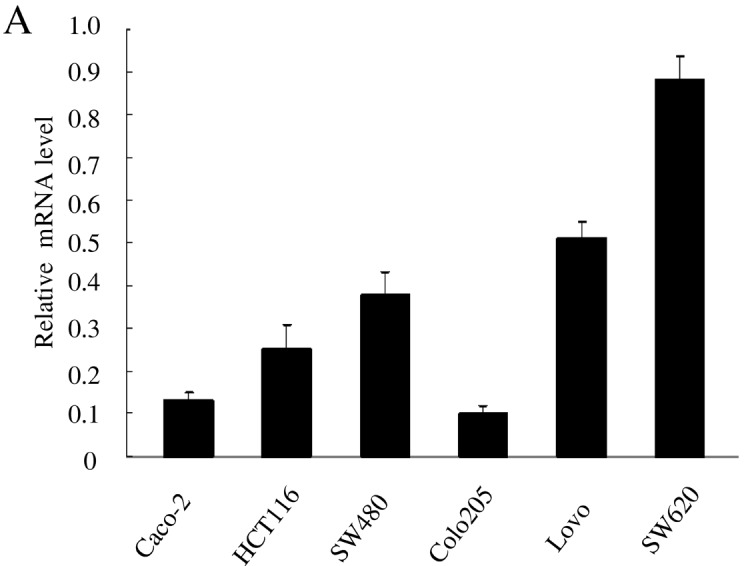
Figure 1.


S100A4 expressions in six colorectal cancer cell lines. (A) Real-time PCR analysis of S100A4 expressions. Data represent the mean ± standard deviation (SD) of three independent experiments. (B) Western blotting of S100A4 expressions. The S100A4 expression in the SW620 cell line was highest at the mRNA and protein level, and the expression levels of the six cell lines roughly coincided with their invasive potential.
