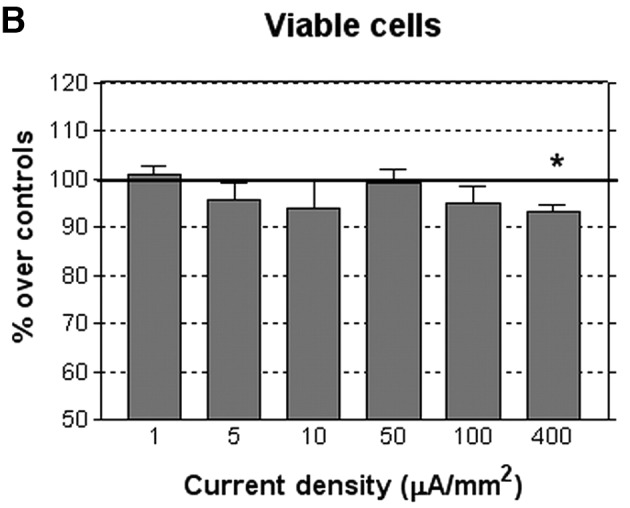
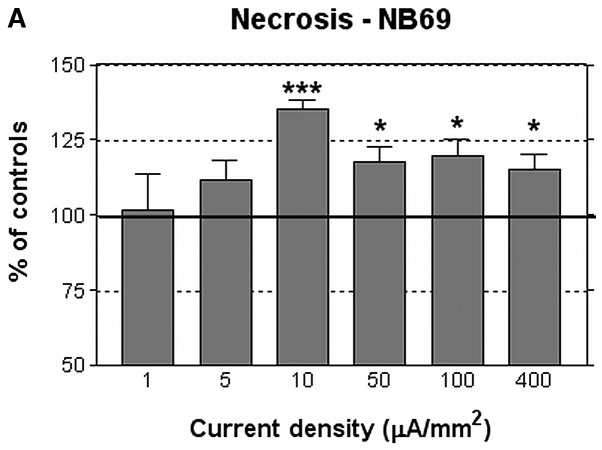
Figure 3.

(A) Rate of necrosis in NB69, quantified by trypan blue dye. Necrotic cells after 24 h of stimulation with different current densities. (B) Viability rate in NB69, quantified by trypan blue dye. Viable cells after 24 h of stimulation with different current densities. Data are normalized over the corresponding control samples. Means ± SEM of three or four replicates for each current density tested, with 5 exposed dishes and 5 controls per replicate and current density. ***p<0.001; *0.01< p<0.05, Student's t-test.

