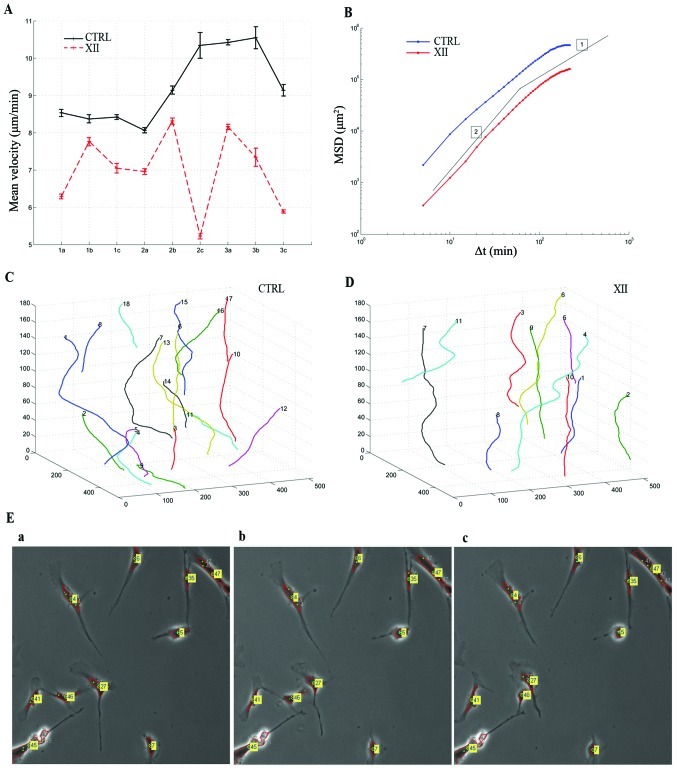
Figure 6.
In vivo cell tracking analysis. (A) Mean velocity (Y-axis) of cell tracks in 9 different image sequences (X-axis) of control (CTRL) and treated (XII) MSC. Error bar indicates SD. (B) MSD <r2(Δt)> versus time lag Δt for CTRL and XII MSC. Thin lines indicate logarithmic slopes of 1 and 2. (C and D) Trajectory plot of tracked cells in the sequence (C) CTRL 3c and (D) XII 3c. XY-plane units are in pixel, whilst Z unit is video frame number. (E) Three subsequent frames (Δt = 5 min) extracted from the sequence CTRL 3c showing tracked cells.

