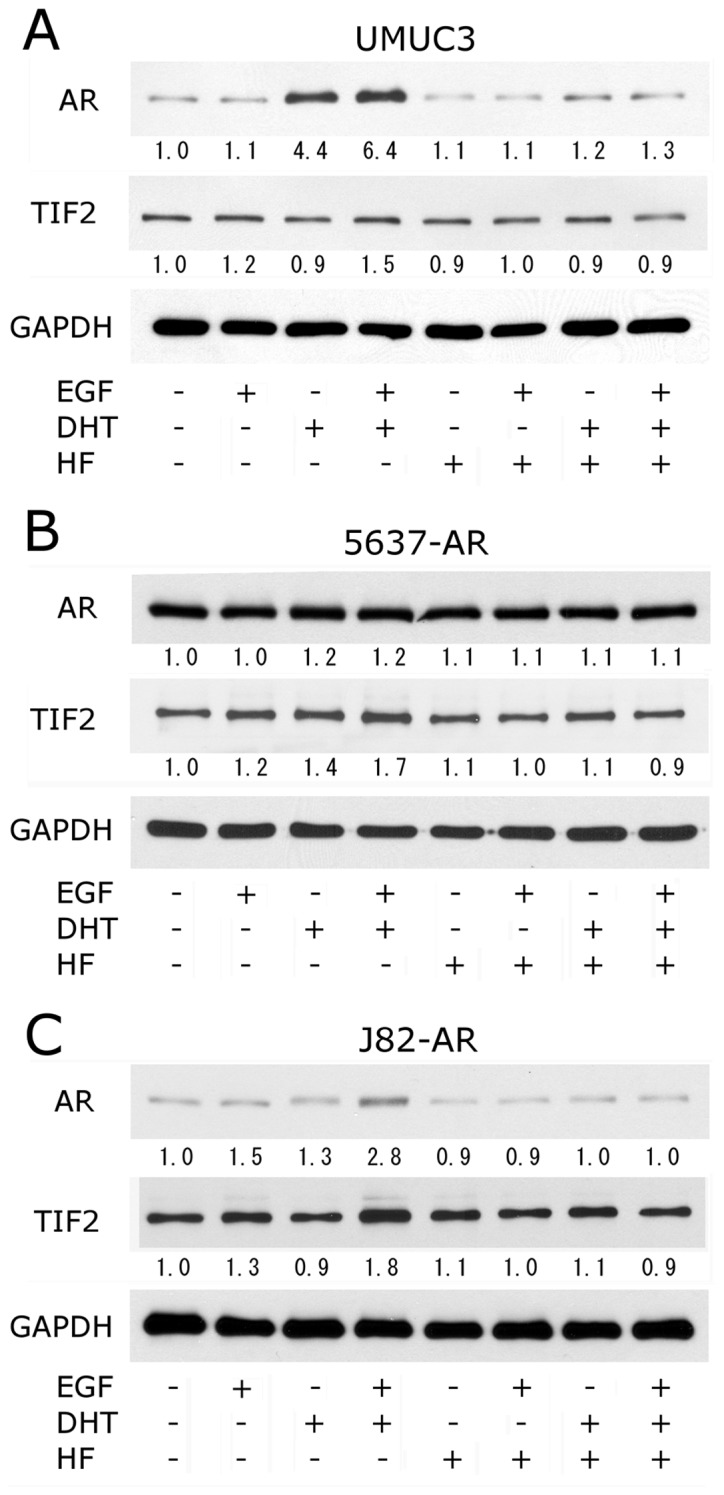
Figure 4.

Effects of EGF on AR and TIF2 protein expression. Bladder cancer cells (A, UMUC3; B, 5637-AR; C, J82-AR) were cultured for 24 h in the presence of ethanol (mock), 100 ng/ml EGF, 10 nM DHT and/or 10 μM HF, as indicated. Equal amounts of protein extracted from each cell line were immunoblotted for AR (110 kDa, upper), TIF2 (160 kDa, middle), or GAPDH (37 kDa, lower) as indicated. Densitometry values for specific bands standardized by GAPDH that are relative to those of mock treatment (first lanes; set as 1-fold) are included below the lanes.
