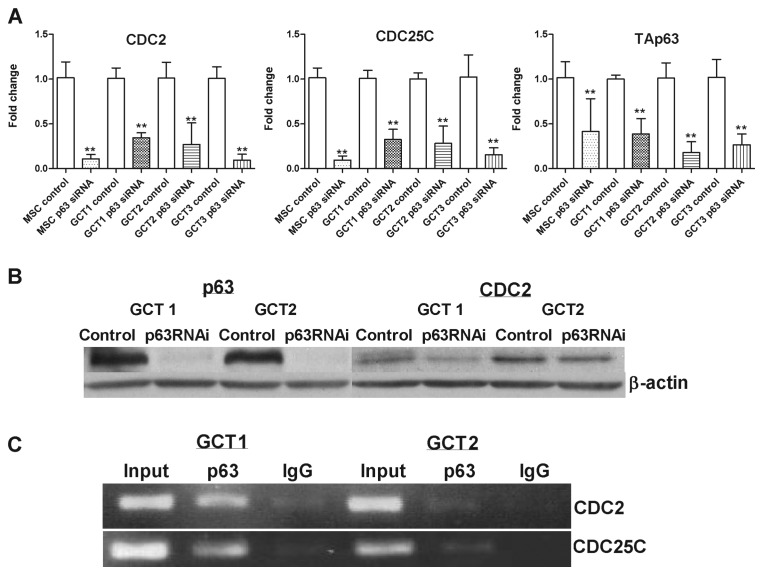
Figure 5.
(A) Suppression of p63 expression reduced CDC2 and CDC25C gene expression. MSCs and GCTSCs were transfected with control or p63 siRNA. The mRNA expression of TAp63, CDC2 and CDC25C was evaluated by real-time PCR. Error bars represent SD of three independent experiments, **p<0.01 compared with control by Student’s t-test. CDC2 protein level was also downregulated by p63 siRNA treatment at 48 h in GCTSCs and measured (B) by western blot analysis. (C) In vivo binding of p63 to the regulatory regions of CDC2 and CDC25C genes. Formaldehyde cross-linked chromatin was extracted from two different GCTSC cell lines and immunoprecipitated with the p63 antibody. DNA was extracted and analyzed by PCR. One representative result of three independent experiments is shown.

