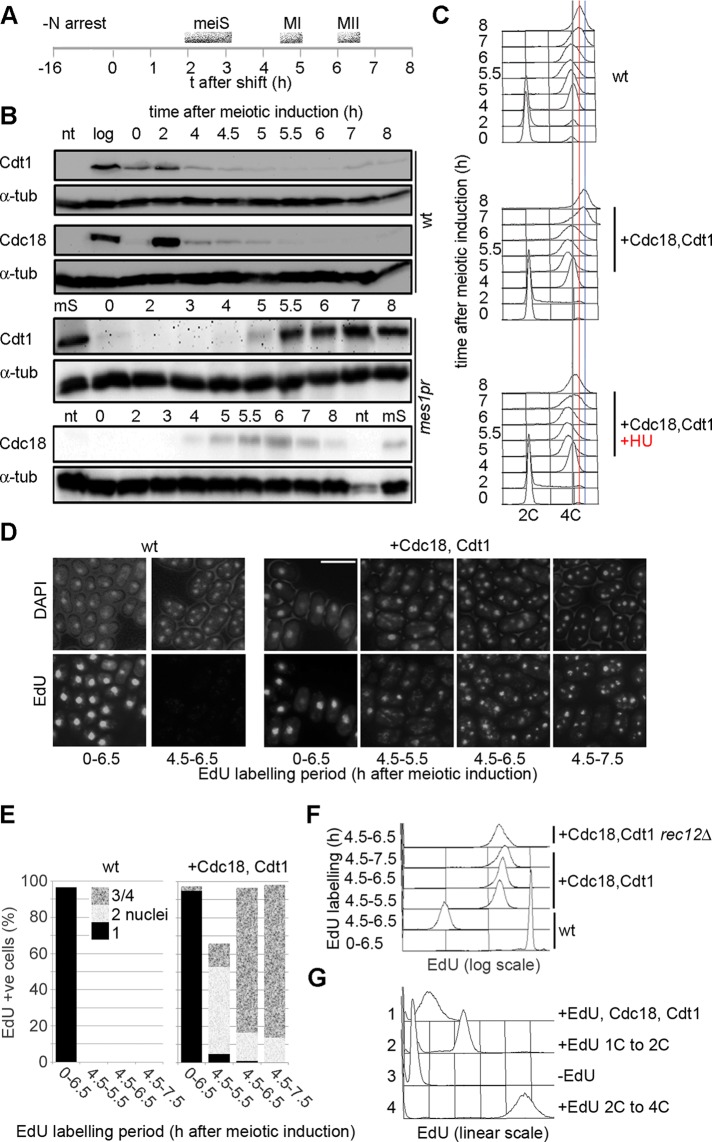
FIGURE 1:
Expression of Cdc18 and Cdt1 in late meiosis causes DNA replication after MI. (A) Scheme of meiotic synchronization. Cells were arrested in G1 by nitrogen starvation for 16 h at 26°C; at t = 0 cells were refed and shifted to 34°C to inactivate Pat1. Timing of meiotic events is shown. (B) Levels of Cdt1 and Cdc18 in a pat1-induced meiosis. Top (wt), wild-type levels of expression (P1416, P1424); bottom (mes1pr), show expression levels of tagged Cdt1 and Cdc18 expressed from additional integrated gene copies under the control of the mes1 promoter (P2453). The ploidy of the pat1 strains does not affect the kinetics of Cdt1 and Cdc18 expression (unpublished data). Tagged proteins were used for mes1pr expression, but strains in which Cdc18 and Cdt1 function is solely provided by tagged copies are not compromised for DNA replication. α-Tubulin is shown as a loading control. log, log-phase cells; mS, cells in meiS; nt, cells with no tag. (C) DNA contents of cells executing meiosis. Top, analysis of wt (pat1-114) cells (P2454); bottom, mes1pr-cdc18, cdt1 cells (P2453), expressing Cdc18 and Cdt1 in late meiosis. Bottom, HU was added 4.5 h after meiotic induction, that is, after meiS. Gray line indicates 4C DNA content, red line indicates 4C DNA content of wt cells in late meiosis; blue line indicates the peak position at 8 h in the mes1pr-cdc18, cdt1 strain (>4C). Meiotic progression analysis is shown in Figure 2A. (D) Wild type (P3032, left) and mes1pr-cdt1, cdc18 (P3031, right) cells were induced to enter meiosis and labeled with EdU (10 μM) for the periods shown. Cells were imaged after conjugation to fluorescent azide. Bar, 10 μm. (E) Analysis of experiment shown in D, showing percentage of cells with nuclear EdU labeling and proportion of cells with one, two, or three/four nuclei. (F) Flow cytometric quantitation of EdU incorporation in cells from D. Also shown is analysis of a rec12Δ strain (P2459) expressing Cdc18 and Cdt1 in late meiosis and wt cells (P3032) incorporating EdU in meiS. (G) Quantitation of EdU incorporation in a mes1-Cdc18, Cdt1 in late meiosis (histogram 1) compared with EdU incorporation in haploid (2) or diploid (4) cells executing a complete S phase; also shown is a –EdU control (3). Comparison with these standards indicates that ∼15% of the genome has replicated in the MI–MII interval.

