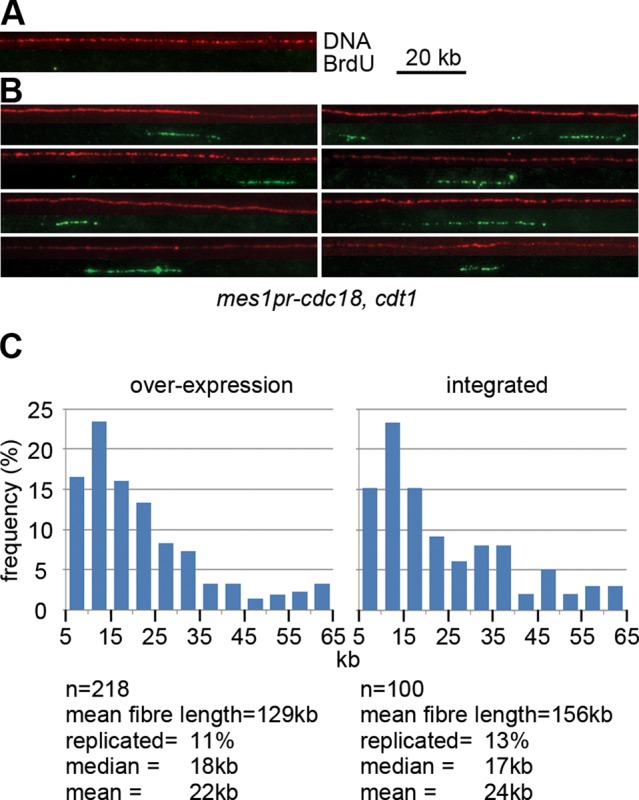
FIGURE 6:

Analysis of DNA replication in the meiosis I–II interval by molecular combing. (A, B) DNA combing analysis of DNA fibers from cells in late meiosis. Representative images of the combed DNA fibers from (A) control strain (P3023) and (B) a strain expressing Cdc18 and Cdt1 during late meiosis (P2458, P2463). BrdU was added to cells 4.5 h after meiotic induction, and cells were harvested and processed 1.5 h later. Each panel shows a DNA fiber (shown in red, detected with anti-DNA antibody) and the corresponding image for BrdU detection (shown in green, detected with anti-BrdU). (C) Distribution of BrdU track lengths in cells expressing Cdc18 and Cdt1 in late meiosis from plasmids (left, P2463) or integrated genes (right, P2458). The relationship 10 μm = 20 kb was used for calculating replication track lengths.
