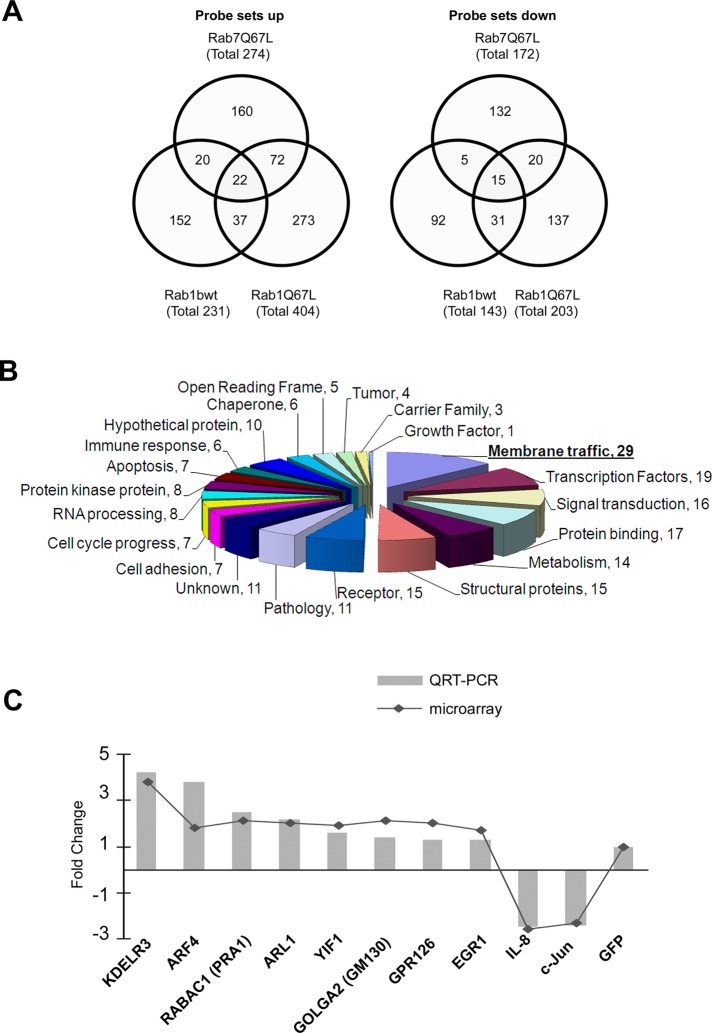
FIGURE 2:
Increase in Rab1b levels modifies gene expression. (A) Venn diagrams showing the number of probe sets modified (up and down) by the indicated GFP-Rab construct (with respect to GFP alone) and the overlap between them. (B) Pie chart showing number of genes, clustered by their functional classification, that were modified by Rab1b increase (the total number of genes was 219). (C) Expression analysis of mRNA levels of some interesting genes plotted as the fold change for each gene in the GFP-Rab1bwt construct cells compared with the GFP-transfected cell line, measured by either microarray (continuous line) or RT-qPCR (gray bars).

