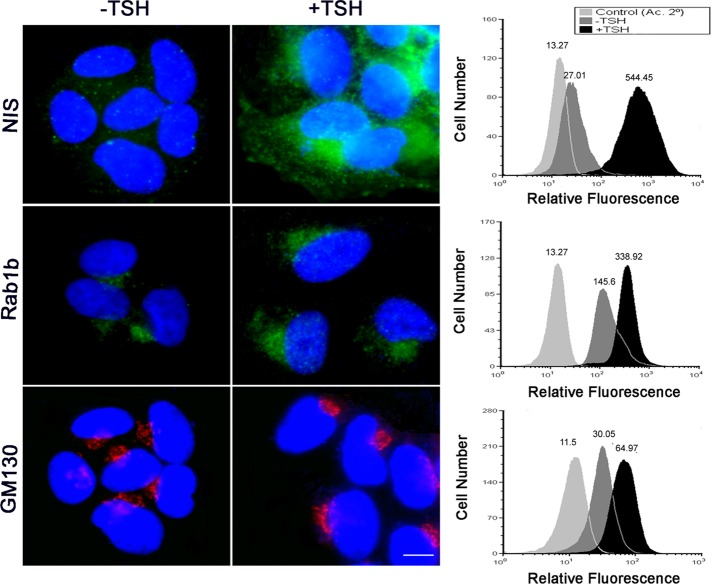
FIGURE 7:
NIS, GM130, and Rab1b increase after TSH stimulation in FRTL5 cells. Left panels, immunofluorescence analysis in basal (−TSH) or stimulated (+TSH) situations; images for each marker were acquired under the same setting conditions. Right panels, flow cytometry analysis to measure fluorescence intensity to detect NIS, GM130, and Rab1b using a secondary antibody labeled with Alexa Fluor 647. Histograms represent profiles in basal (−TSH, dark gray) or stimulated (+TSH, black) conditions for the proteins indicated on the left panel. A total of 5 × 10⁵ cells were analyzed in each situation. Controls (light gray) were performed by incubating cells with only secondary antibody. The geometric mean fluorescence intensity value is indicated on top of each histogram.

