
FIGURE 8:
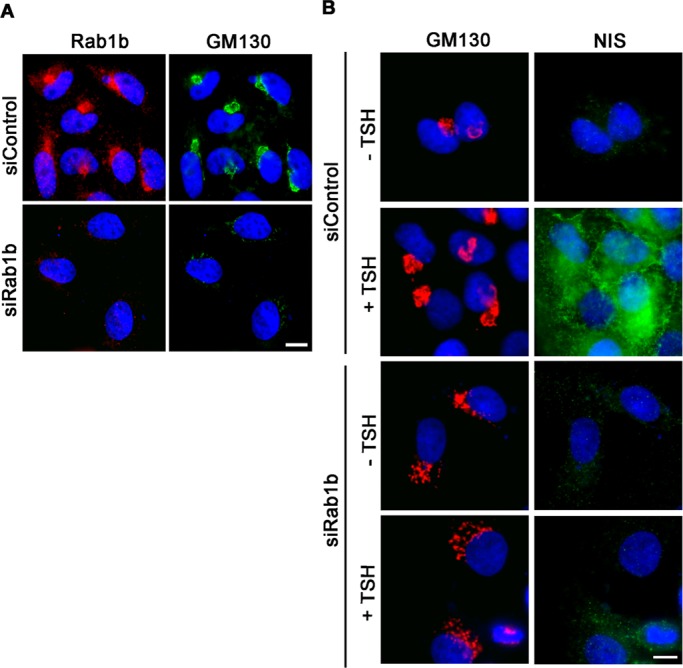
Rab1b depletion blocked GM130 and NIS increases induced by TSH stimulation. (A and B) Immunofluorescence analysis in Rab1b or control siRNA-transfected cells. (A) Rab1b and GM130 patterns after siRNA transfections in TSH-stimulated cells. (B) Effect of Rab1b siRNA transfection in basal condition (−TSH) or after TSH stimulation (+TSH). Images for each marker were acquired under the same setting conditions.