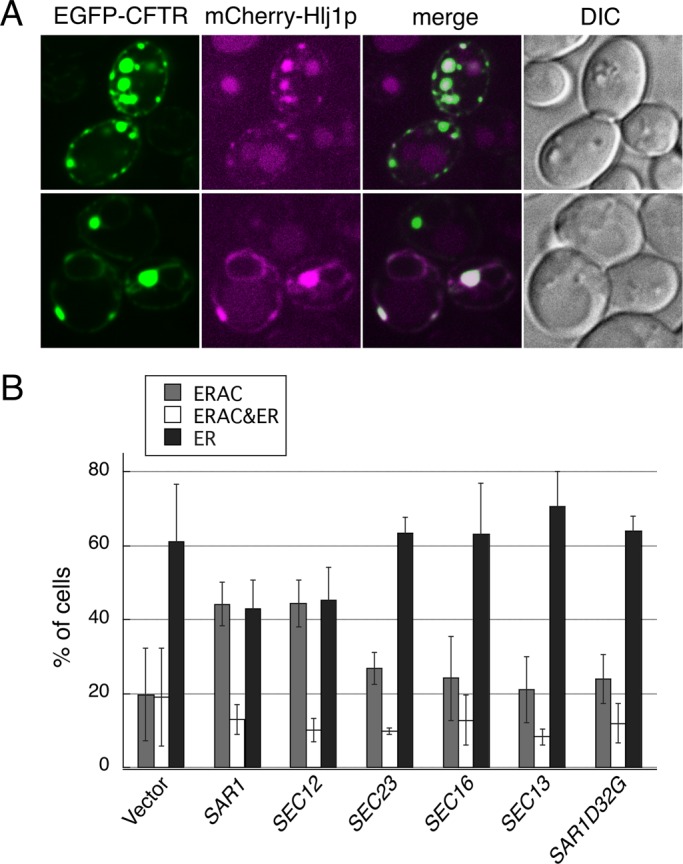
FIGURE 8:

Hsp40s and COPII components act in the same pathway to drive ERAC formation. (A) hlj1∆ cells coexpressing EGFP-CFTR (induced as described in Figure 1A) and mCherry-Hlj1p were observed by confocal microscopy. (B) hlj1∆ cells harboring pEGFP-CFTR were transformed with pYO324 (2 μ vector), pSAR1 (2 μ SAR1), pSEC12 (2 μ SEC12), pSEC23 (2 μ SEC23), pSEC16 (2 μ SEC16), pSEC13 (2 μ SEC13), or pSAR1D32G (2 μ SAR1D32G), and the transformants were grown to mid–log phase and induced with copper at 23ºC for 2 h to induce EGFP-CFTR expression. ERAC formation was quantified as described in Figure 1B. The experiments were repeated at least three times, and >150 cells were analyzed for each condition.
