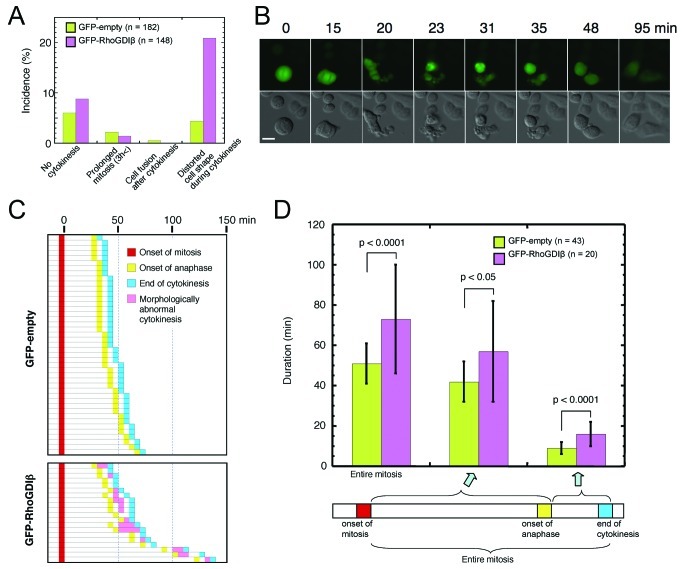
Figure 4.
Time-lapse analysis of mitosis of HeLa cells expressing GFP-RhoGDIβ. Cells were cultured in 35-mm glass-bottomed dishes. GFP fluorescence images and DIC images were acquired on an Axiovert 200 M inverted microscope every 5 min for 30 h. (A) Incidence of mitotic abnormalities. (B) Representative images of severely distorted cell shape during cytokinesis of GFP-RhoGDIβ-expressing cell. Bars, 20 μm. (C) Among the cells observed (A), the mitotic cells, in which the mitotic processes were clearly distinguished by the criteria as described in Materials and methods and the entire mitotic duration was less than 3 h, were analyzed. Horizontal columns indicate the mitotic progression of individual cells. n=43, GFP-empty; n=20, GFP-RhoGDIβ. (D) The mean values of mitotic duration of cells (C) were compared. Bars indicate SD. *p<0.005 by the Mann-Whitney U-test.

