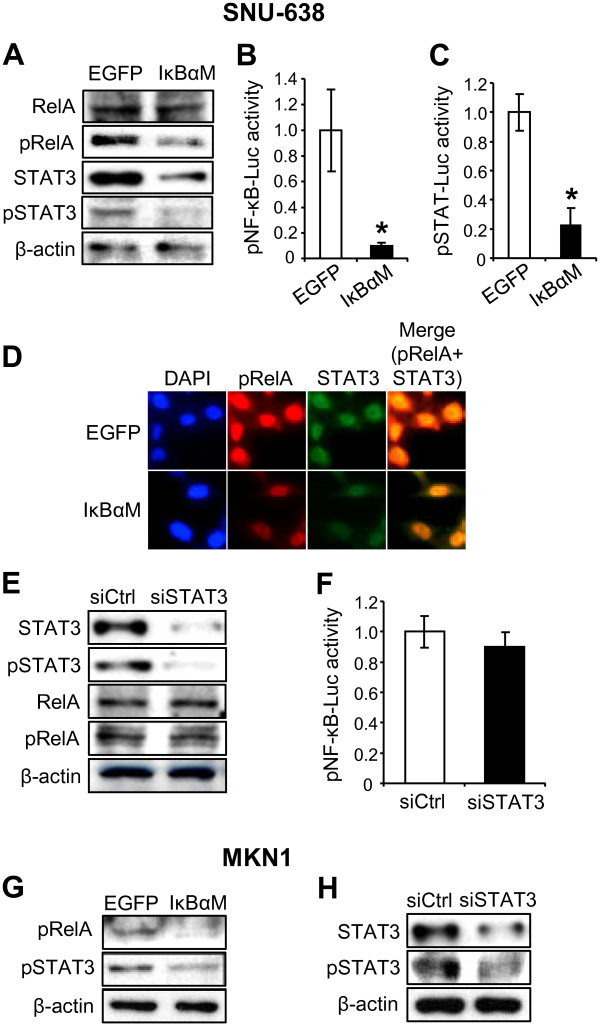
Figure 2.
Effect of downregulation of NF-κB p65 on the STAT3 activation in gastric cancer cells and vice versa. (A-D) SNU-638 cells were infected with either MFG.IκBαM.IRES.puro (IκBαM) retroviral vector or empty (EGFP) vector. (A) The protein expressions of total NF-κB p65 (RelA), phospho-Ser536-NF-κB p65 (pRelA), total STAT3 and phosphor-Tyr705-STAT3 (pSTAT3) were determined by immunoblotting. (B) Cells were transiently co-transfected with pNF-κB-luciferase and a β-galactosidase vector, and effect of IκBαM overexpression on NF-κB transcriptional activity was determined by luciferase reporter assay. Each bar represents the mean ± SD (n = 6). * P < 0.05 versus control cells infected with an empty vector. (C) Cells were transiently co-transfected with pSTAT-luciferase and a β-galactosidase vector, and effect of IκBαM overexpression on STAT transcriptional activity was determined by luciferase reporter assay. Each bar represents the mean ± SD (n = 5). * P < 0.05 versus control cells infected with an empty vector. (D) 4’,6’-Diamidino-2-phenylindole staining (blue) and double immunofluorescence staining showing the nuclear colocalization of pRelA (red) and STAT3 (green). (E and F) SNU-638 cells were transiently transfected with control siRNA (siCtrl) or STAT3 siRNA (siSTAT3). (E) The effects of STAT3 silencing on the protein expressions of total STAT3, pSTAT3, total RelA and pRelA were determined by immunoblotting. (F) Luciferase reporter assay was performed to show the regulation of NF-κB activation by STAT3 after STAT3 silening. Each bar represents the mean ± SD (n = 6). * P < 0.05 versus control siRNA-transfected cells. (G) Immunoblotting for pRelA and pSTAT3 in MKN1 cells after IκBαM overexpression. (H) Immunoblotting for total STAT3 and pSTAT3 in MKN1 cells after STAT3 silencing.

