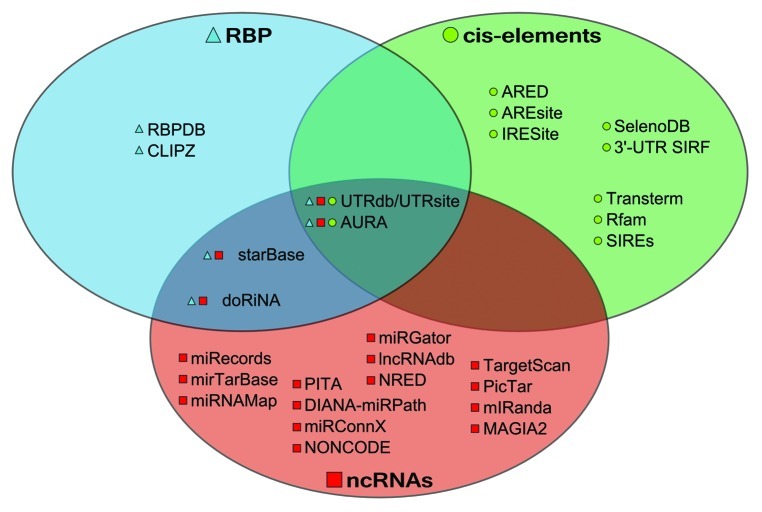
Figure 1. Venn diagram showing the classification of the analyzed resources according to their biological focus. Symbols next to the resource name correspond to each set (triangles for RBPs, squares for ncRNAs and circles for cis-elements) and further highlight the presence of a limited number of integrative tools, with most of the resources being confined to only one kind of regulatory element.

An official website of the United States government
Here's how you know
Official websites use .gov
A
.gov website belongs to an official
government organization in the United States.
Secure .gov websites use HTTPS
A lock (
) or https:// means you've safely
connected to the .gov website. Share sensitive
information only on official, secure websites.
