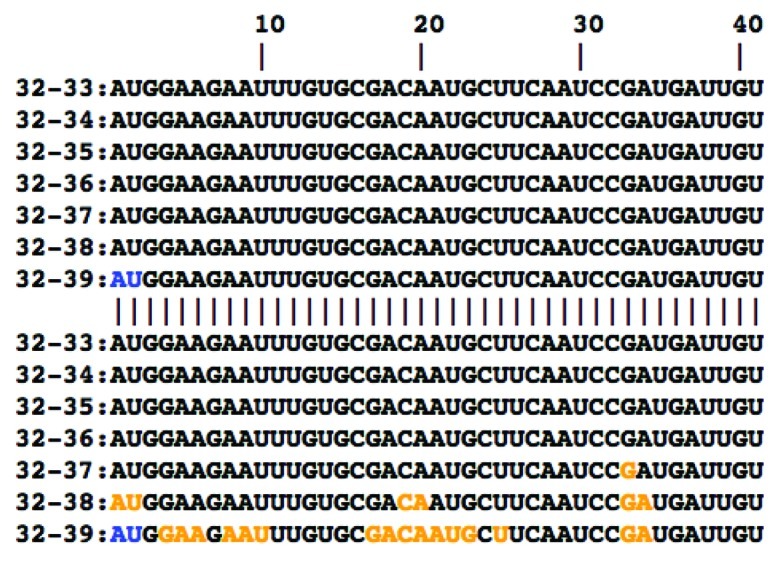
Figure 1. Comparison of significantly changing positions between the PA mRNA of Len/wt (upper 7 rows) and Len/17/ca (lower 7 rows). Each row corresponds to a difference vector v32–33, …, v32–39 containing changes of base pairing probabilities between 32°C and a particular higher temperature. Positions in which base paring probabilities significantly change with temperature elevation in both sequences and those where these changes only affect one of the phenotypes are marked blue and orange, respectively. Only the first 40 bases of each sequence are shown; position numbers of the coding sequence are indicated at the top of the alignment.
