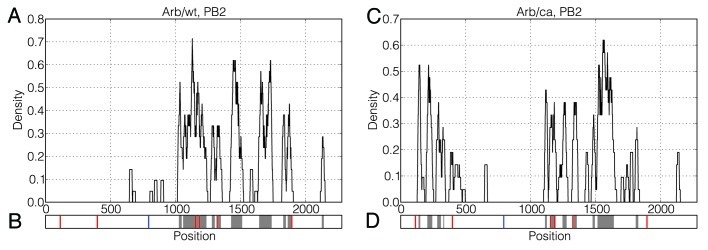
Figure 2. Distributions of significantly changing positions along the PB2 mRNAs of Arb/wt and Arb/ca. A sliding window of size 20 was moved in steps of 1 position over the vector v32–39 and the percentage of significantly changing positions in the window was calculated for each possible starting position. The resulting density plots are depicted in Figure 2A and Figure 2C. Location of clusters of significantly changing positions identified by the DBSCAN algorithm are depicted in Figure 2B and Figure 2D with gray color. Synonymous and non-synonymous mutations are depicted in Figure 2B and Figure 2D with red and blue vertical lines, respectively.
