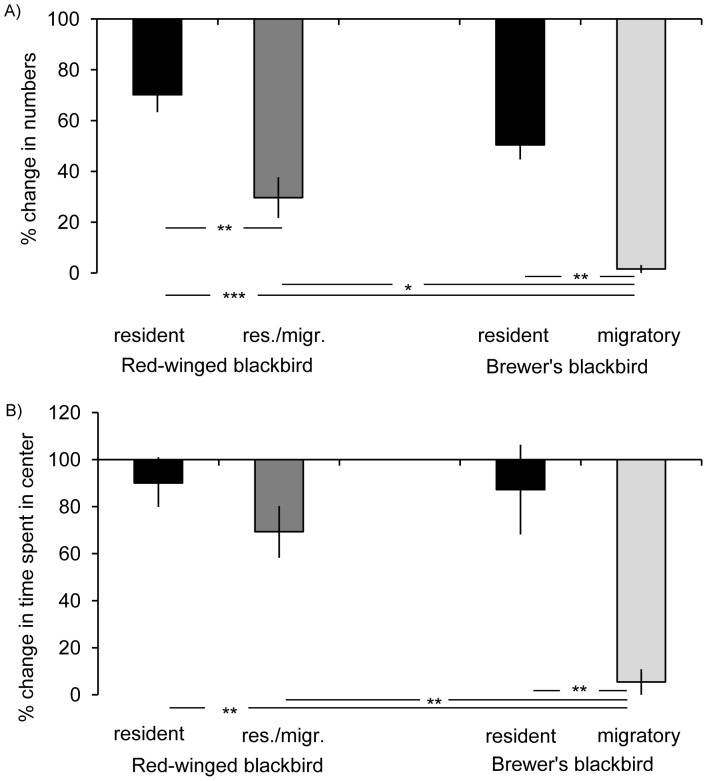
Figure 3. Neophobia reactions within species.
Means and standard errors of changes in behavior between control trial 1 and experimental trial are shown for A) number of individuals in center and B) time spent in center for resident and migratory Brewer’s blackbirds and resident and resident/migratory red-winged blackbirds. Changes are given in percent relative to the values during control trial 1 which were set to 100%. Black bars: residents; dark grey bars: resident/migrants; light grey bars: migrants; Res./migr.: resident/migratory; *p<0.05, **p<0.01, ***p<0.001.

