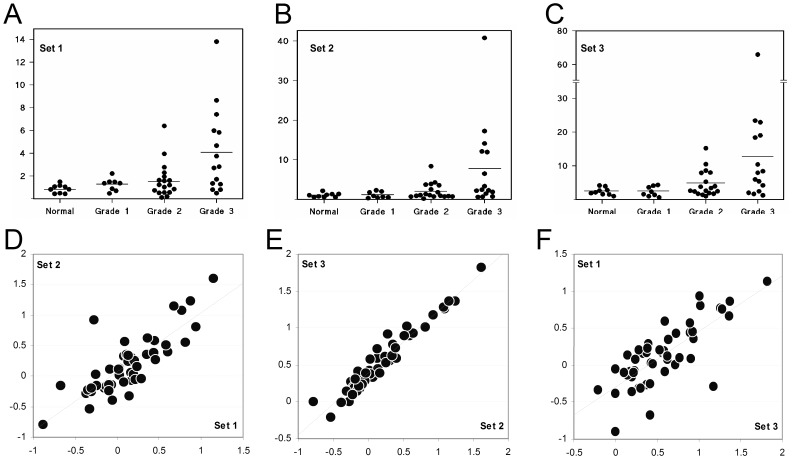
Figure 3. Quantitative Real-Time PCR of QSOX1 transcripts in a panel of RNA samples from normal and breast cancer tissue samples, clinically graded using the Nottingham prognostic index.
Data for three different TaqMan probe sets are shown (panels A-C). In all panels the vertical axis is relevant abundance normalised to 18s rRNA levels. A: Primer Set 1 (based on the QSOX1 CDS). B: Primer Set 2 (based on the QSOX1 3′UTR). C: Primer Set 3 (based on the QSOX1 3′UTR). The horizontal line in each dot plots shows mean expression data for each probe set/condition D: Scatter plot for Set 2 vs. Set 1 data across all preparations. E: Scatter plot for Set 3 vs. Set 2 data across all preparations. F: Scatter plot for Set 1 vs. Set 3 data across all preparations. For all scatter plots, all axes show relevant abundance values for the relevant probe set in logarithmic scale. Best fit linear regression is shown as a dotted diagonal line.

