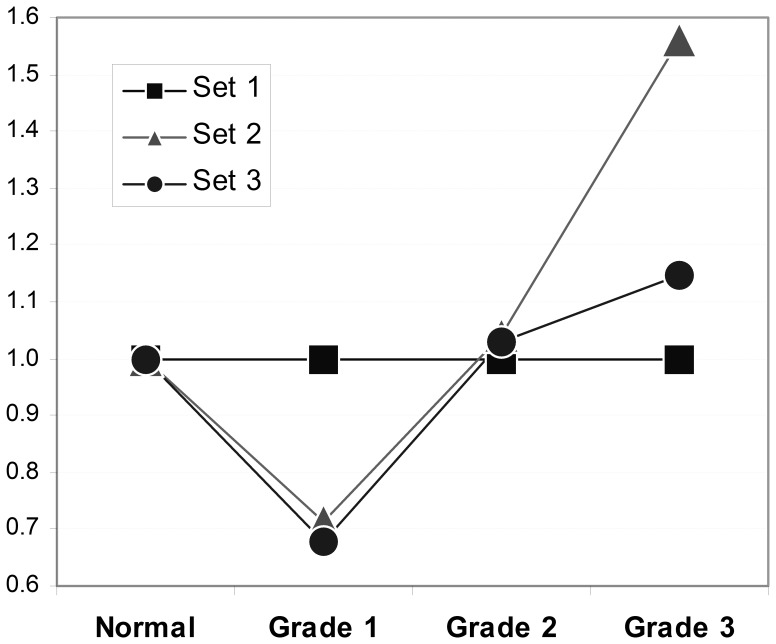
Figure 4. Differential overexpression of the CDS and 3′UTR of QSOX1.
Mean expression data (as in Figure 2A–C) for the three different TaqMan probe sets normalised per mean expression data for probe Set 1 are shown. Sets 2 and 3 (3′UTR region of QSOX1) show a lower degree of expression in Grade 1 tumours and a higher degree of expression in Grade 3 tumours relative to Set 1 (QSOX1 CDS).

