
Figure 1.
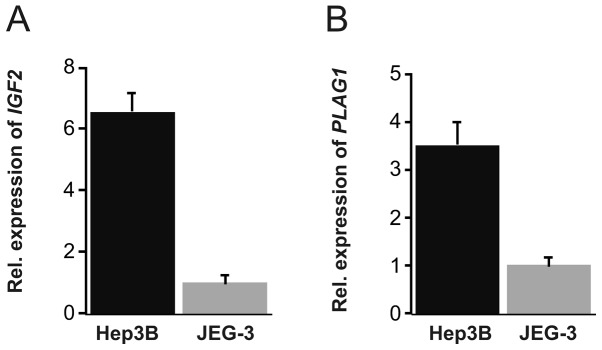
Detection of IGF2 and PLAG1 transcripts in Hep3B and JEG-3 cells. (A) qRT-PCR analysis of the relative expression level of IGF2 mRNA. (B) Real-time qPCR analysis of PLAG1 mRNA. All experiments were run in triplicate. Error bars denote standard error of the mean.